QGIS (Quantum Geographic Information System)
Introduction
QGIS is a free, open-source Geographic Information System application. It lets you retrieve and layer different types of geographic data (satellite images, terrain models, street maps) on top of each other, align them properly, and manipulate them. For our purposes, QGIS serves as a hub where we gather, prepare, and export geospatial data before bringing it into Blender.
While Blender can import some geospatial data, QGIS is specifically designed for handling geographic coordinate systems, projections, and the complexities of real-world mapping data.
Both the .blend file with a baseline result based on the workflow followed on this page, and the accompanying QGIS project file can be downloaded here: Proton Drive
The Interface
Understand the Map Canvas, Layers, and Browser Panel.
Plugins
Extend QGIS with QuickMapServices and QuickOSM.
Export
Prepare data for the BlenderGIS add-on.
Installing QGIS
Download QGIS from qgis.org. The Long Term Release (LTR) version is recommended for stability.
The QGIS Interface
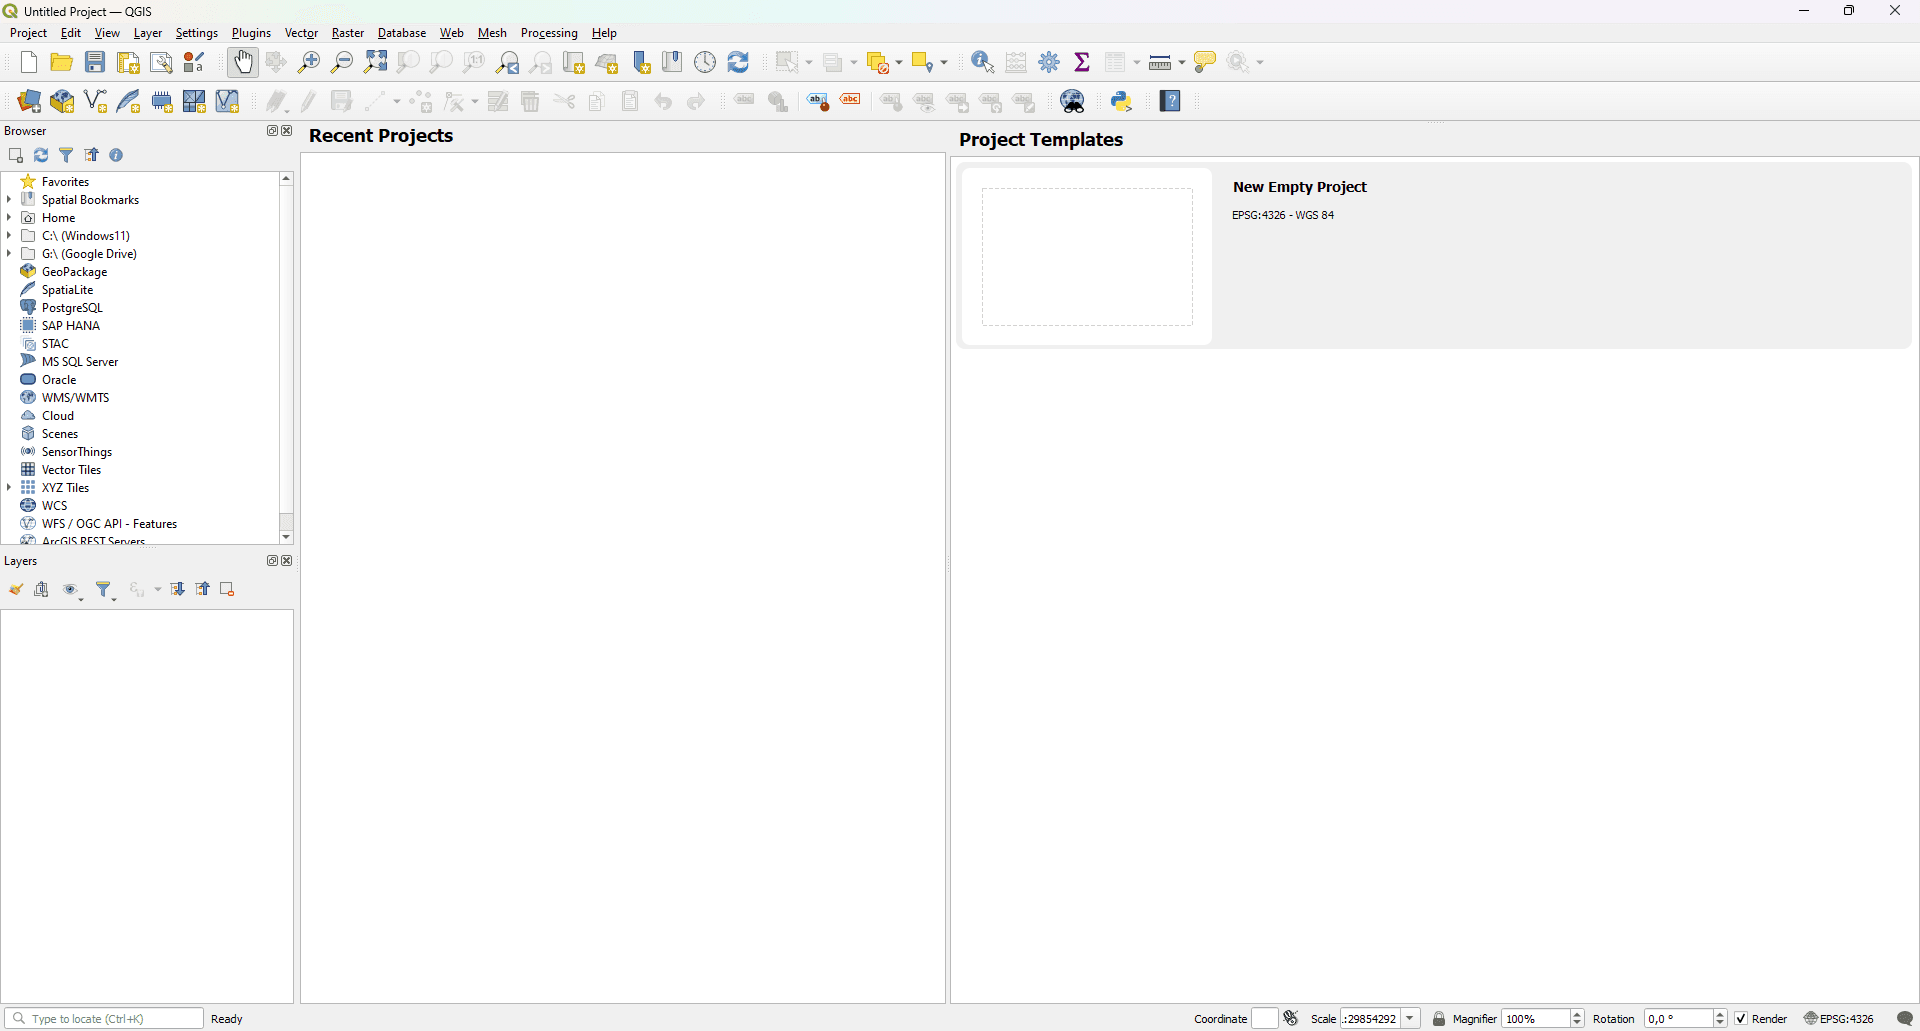
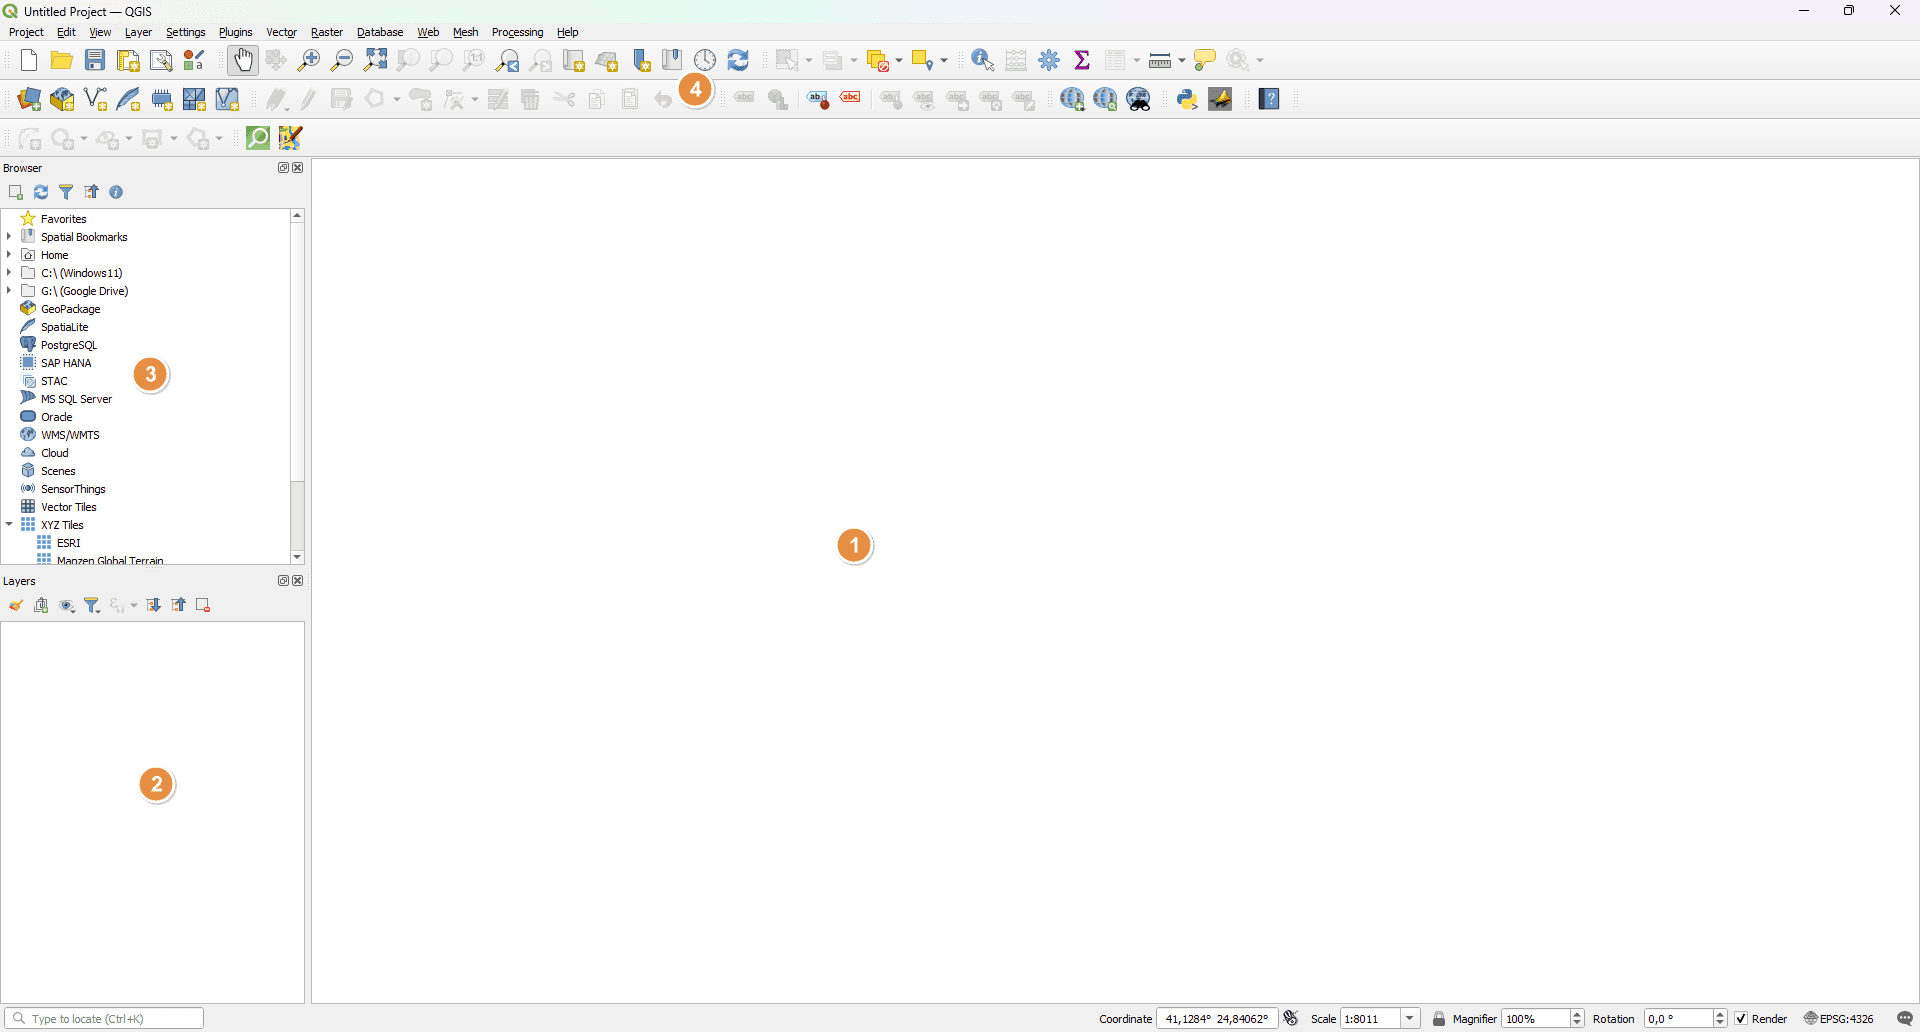
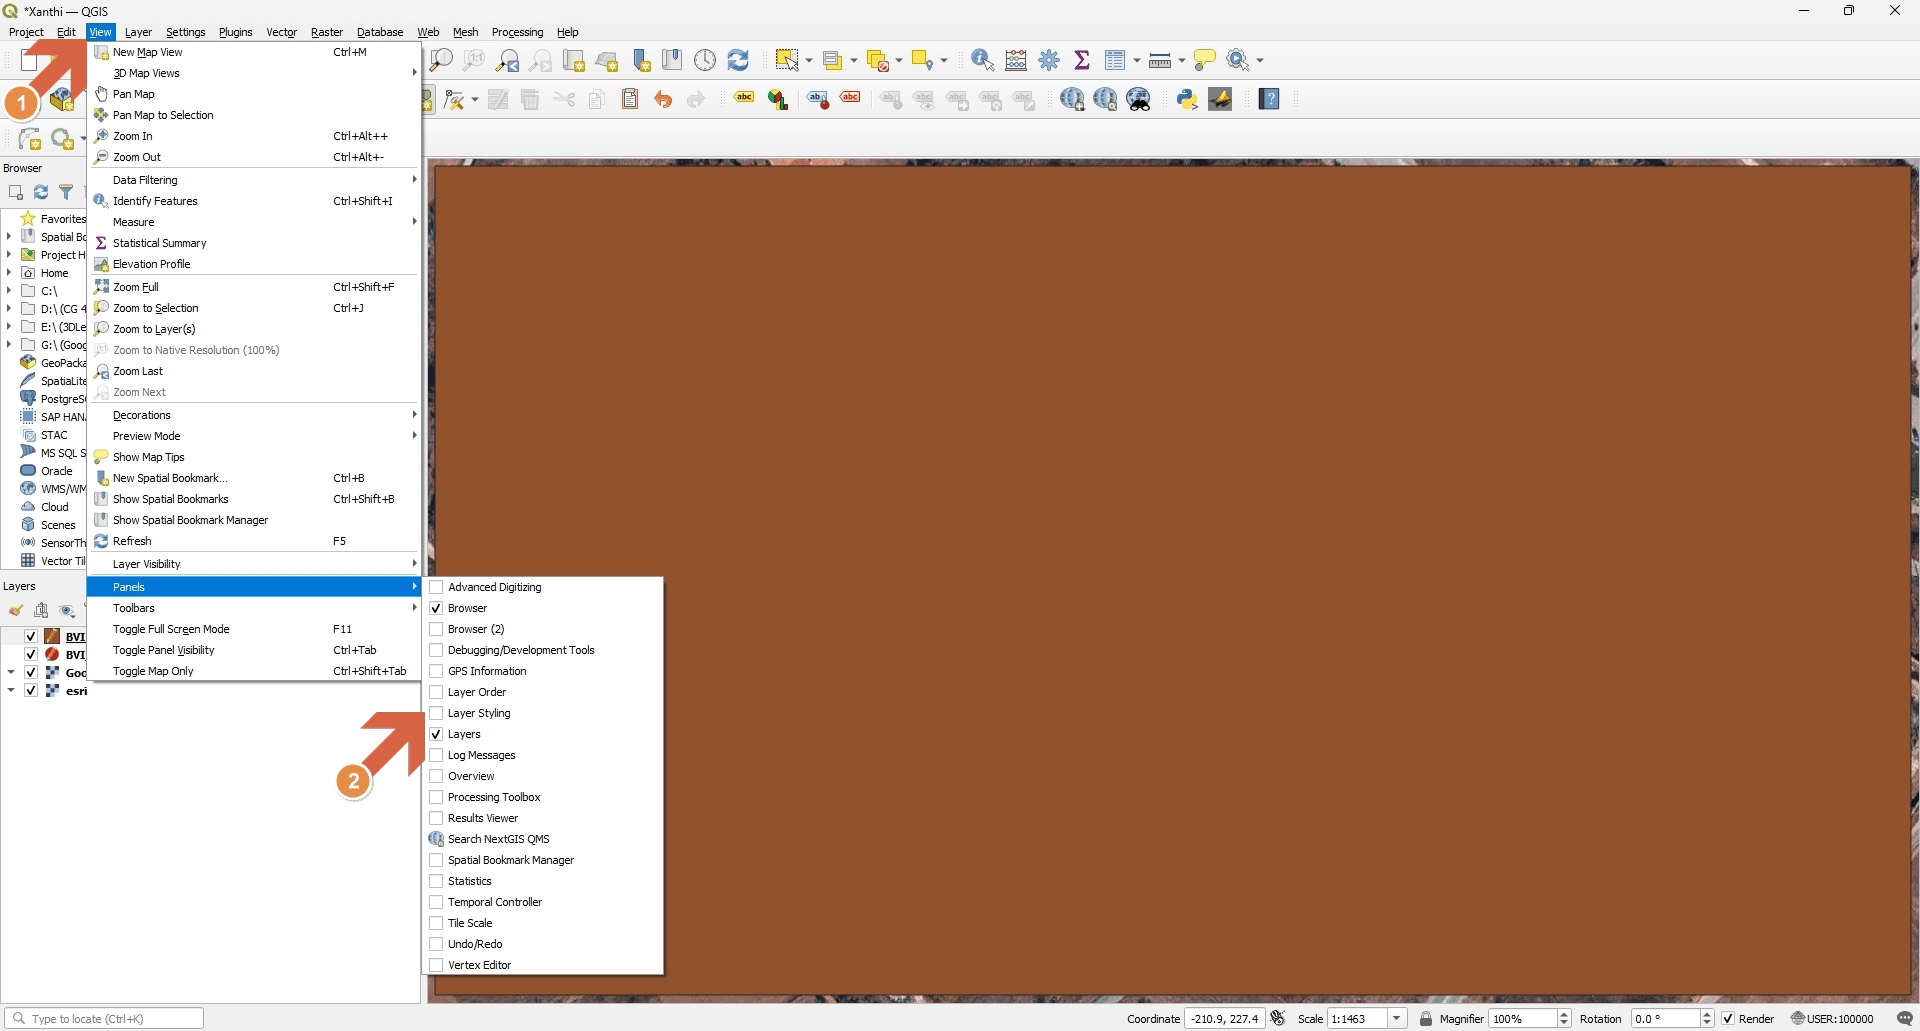
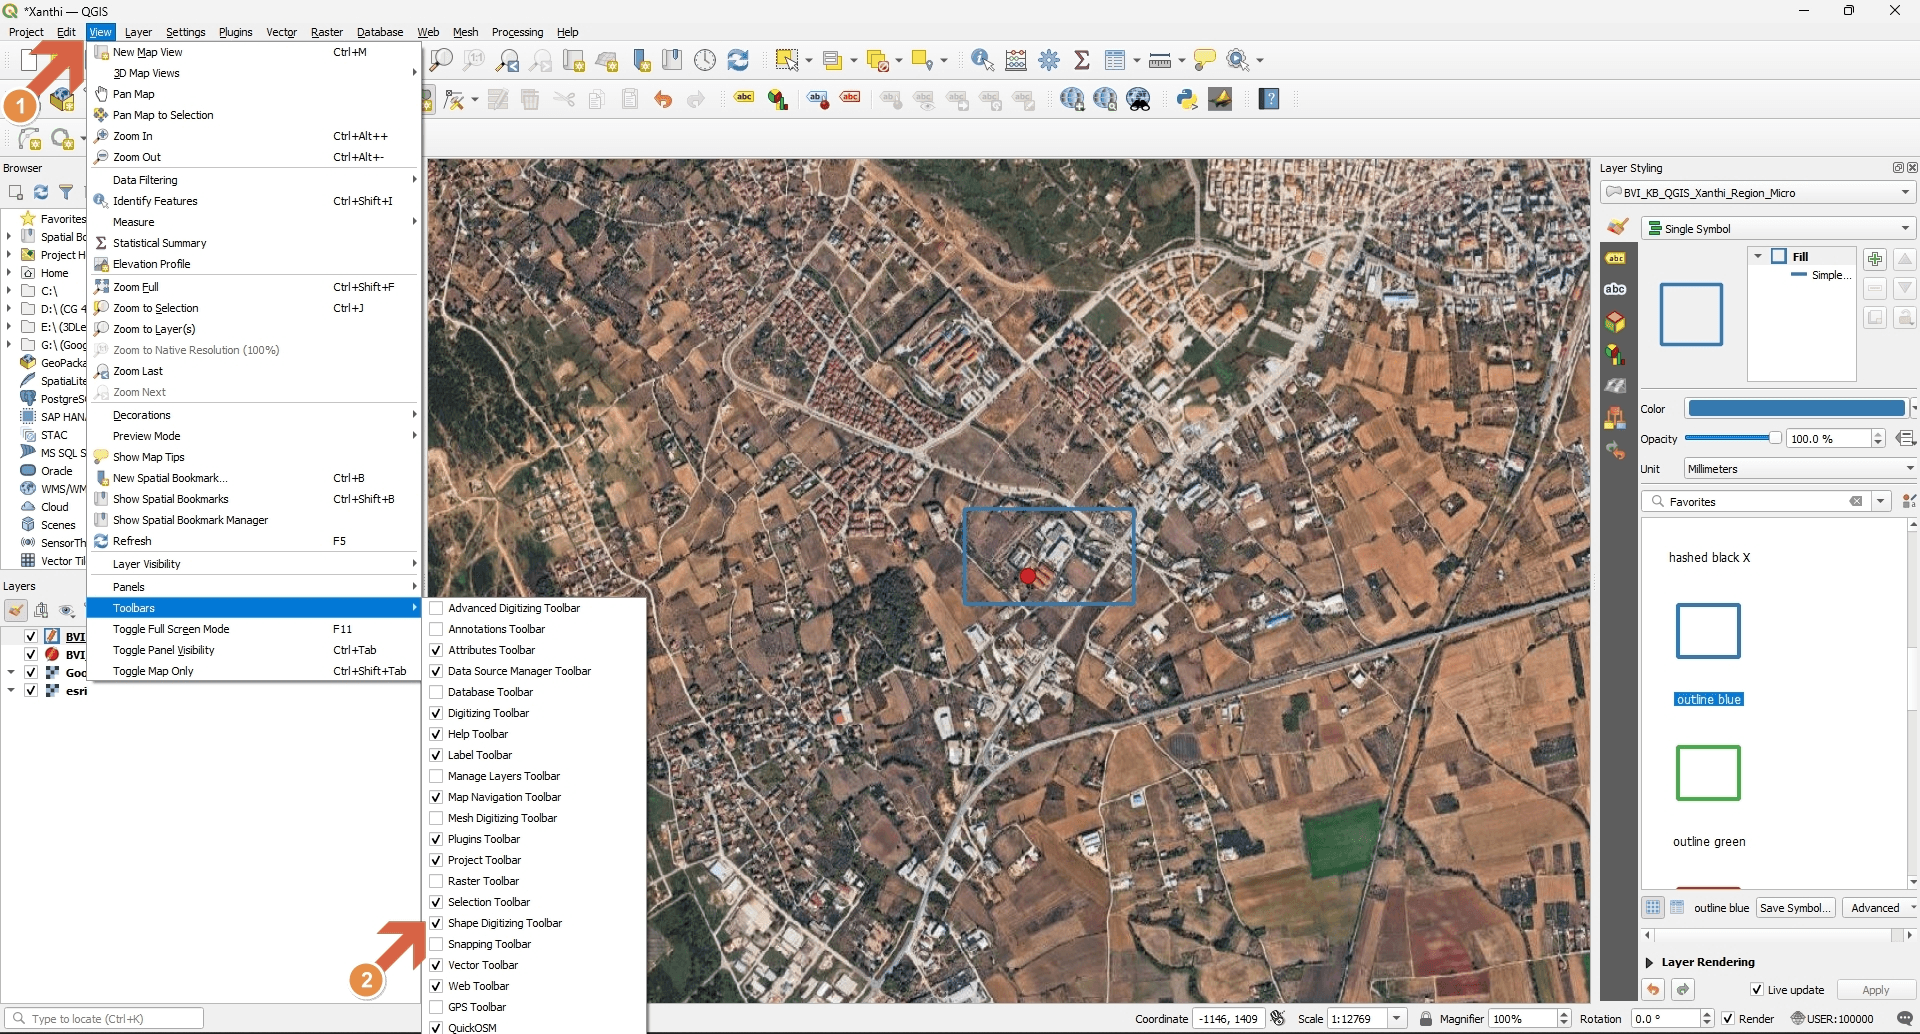
When you open QGIS, you'll first be asked to create a new project. After creating a new project, there are four main areas to focus on:
- Map Canvas
- Layers List
- Browser Panel
- Toolbar
- Add Panels (optional)
The large white area in the center. This is your viewport.
- Navigation: Use the Pan (Hand icon, toolbar) to move and the scroll wheel or Magnifying Glass icons to zoom.
- Right-Click: Often brings up context menus for the map.
This works exactly like layers in Photoshop or Blender.
- Top layers cover bottom layers.
- Checkboxes toggle visibility.
- Right-Click a layer to access "Properties" (Symbology) or "Export" options.
Your file explorer.
- Use this to drag-and-drop downloaded Shapefiles (
.shp) or GeoTIFFs (.tif) directly onto the canvas. - XYZ Tiles: This folder (in the Browser) is where you can find default basemaps like OpenStreetMap.
This contains various tools for navigation, selection, and data manipulation.
- Use the navigation tools to adjust your view.
- Plugins functions will often add their own buttons here once installed.
- Add shapefiles that will help create specified places of interest.
Go to View > Panels to see more panel options. I like to switch on Layer Styling so I have direct access to style elements for shape layers we will add later.
Plugins
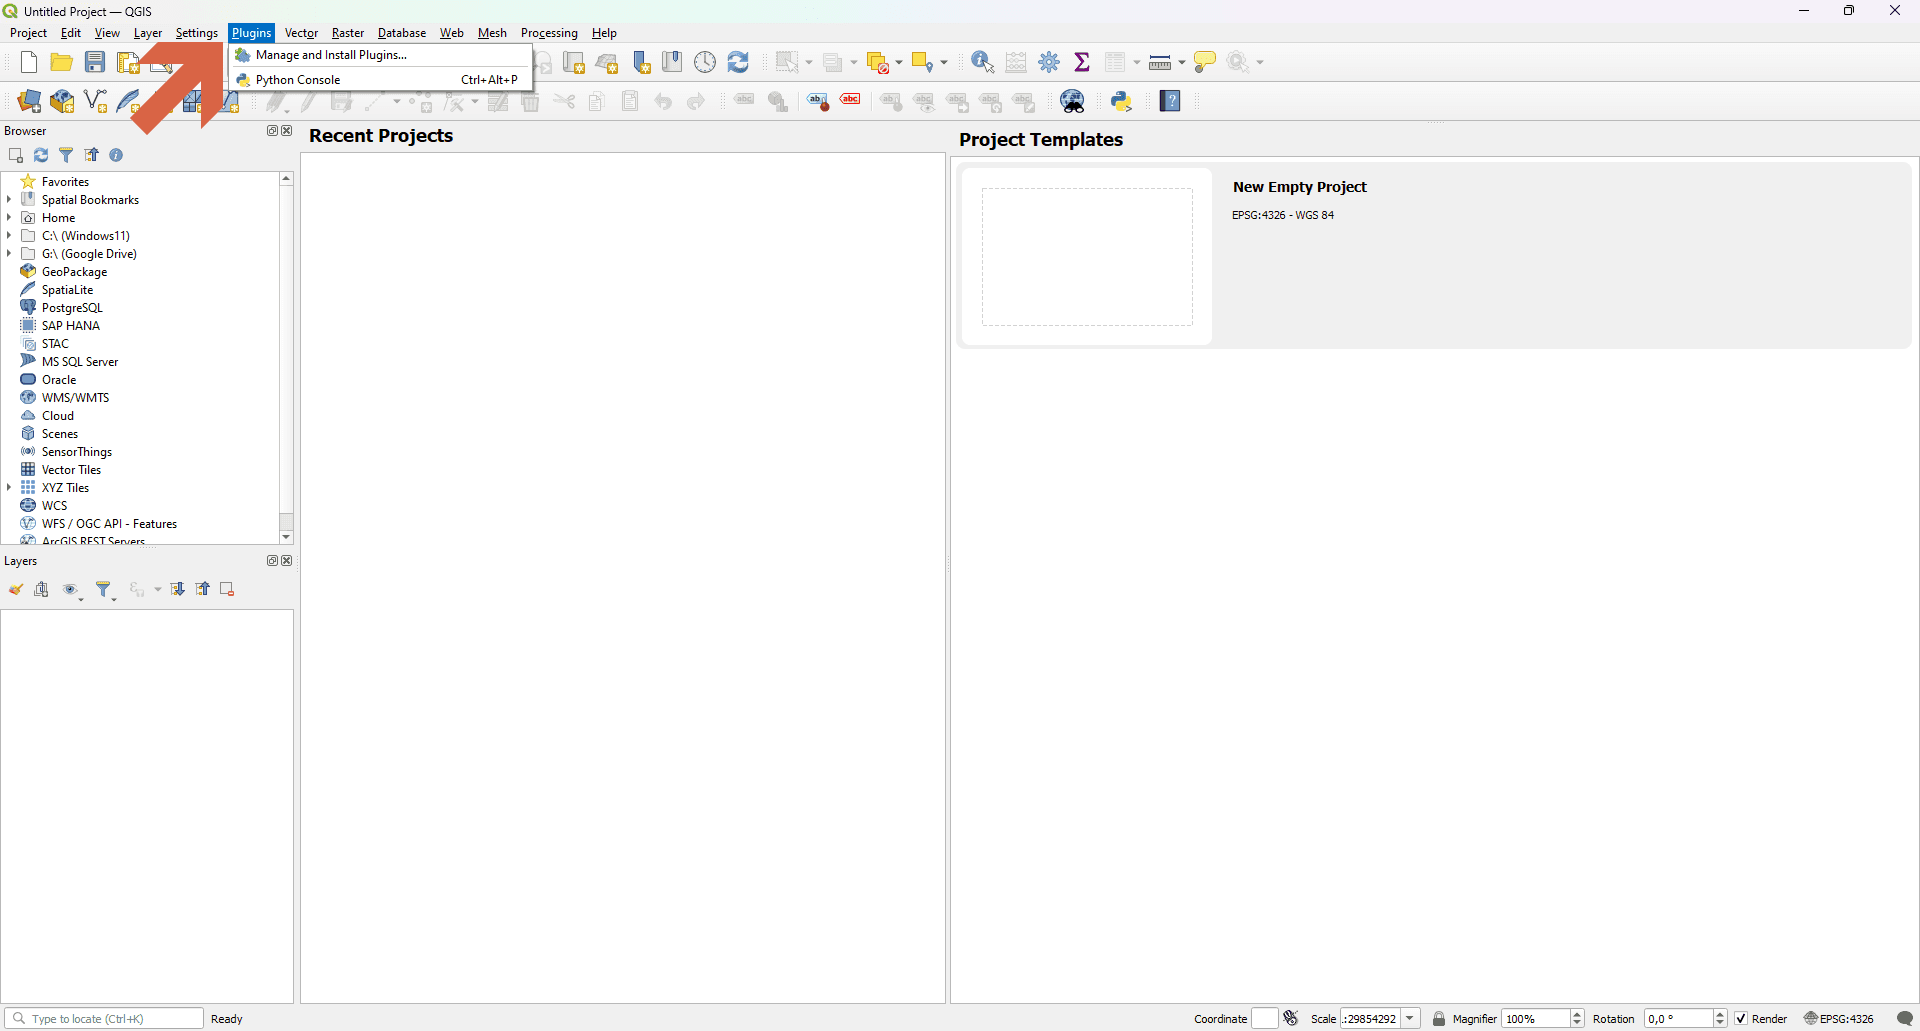
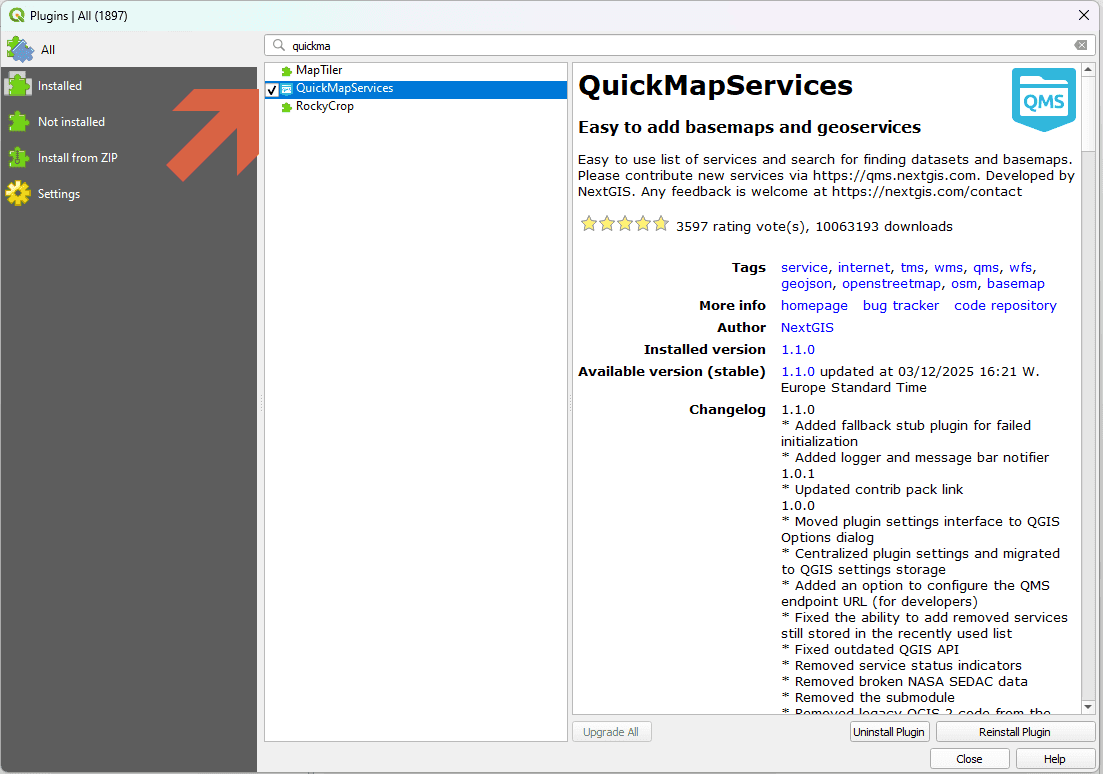
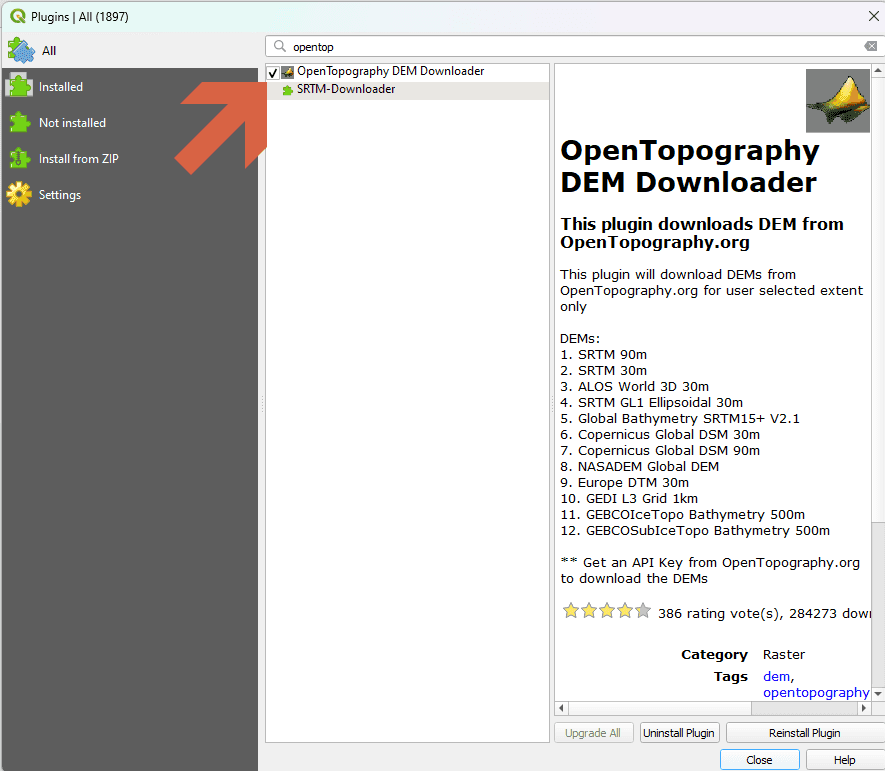
Just like Blender, QGIS's functionality is extended through plugins.
To install plugins:
- Go to Plugins → Manage and Install Plugins
- Search for each plugin by name
- Click Install
- Note: some plugins may require a QGIS restart
Here are the most important plugins we'll use:
-
QuickMapServices: This plugin connects QGIS to online map providers (Google, Bing, OpenStreetMap, and many others). Instead of manually downloading map tiles, you can simply load these services as live background layers. This is an excellent start for accessing satellite imagery.
-
QuickOSM: This plugin allows you to query and download vector data (Eg. building footprints, roads, water bodies) directly from OpenStreetMap. You can specify what type of data you want and the area of interest, and this plugin will fetch that data for you.
-
Open Topography: This plugins downloads Digital Elevation Model (DEM) data, which we'll cover in more detail below. This plugin connects to multiple DEM sources and automates the process of finding and downloading terrain height information.
BlenderGIS: Bridging QGIS to Blender
Download the Plugin / Plugin Page
BlenderGIS is a plugin that allows us to import geographic data from QGGIS into Blender. It understands geographic coordinate systems and can import terrain models, satellite imagery, and vector map data while maintaining proper scale and positioning.
Blender normally works in its own 3D coordinate space (X, Y, Z axes centered around 0,0,0). Real-world geographic data uses coordinate systems based on latitude/longitude or regional grid systems with enormous coordinate values (like "384,000 meters East, 5,234,000 meters North"). BlenderGIS handles the translation between these two worlds.
To install BlenderGIS:
- Download from the official BlenderGIS repository
- In Blender: Edit → Preferences → Add-ons → Install
- Select the downloaded .zip file
- Enable it by checking the checkbox next to "BlenderGIS"
Blosm (BLenderOSM): Blosm is another Blender add-on that specializes in generating 3D buildings from OpenStreetMap data. While useful for quickly creating urban context, BlenderGIS can handle most of what we need and keeps the workflow simpler.
Core Concepts
Before getting into data acquisition, it's good to understand some fundamental concepts about how QGIS and geospatial data works and how we can set things up within QGIS so we get the best data out of it.
Details
### Coordinate Reference Systems (CRS)
Geographic data is defined by a Coordinate Reference System (CRS). This is a mathematical framework used to translate the three-dimensional, irregular surface of the Earth into a two-dimensional coordinate plane. Every CRS consists of two fundamental components:- The Datum (The Shape): A 3D model representing the Earth's size and shape (e.g., the WGS84 ellipsoid). It defines the origin point and the orientation of the axes.
- The Projection (The Flattening): The mathematical formula used to "unroll" the 3D datum onto a flat 2D surface.
The industry standard for web-based tools (Google Maps, Mapbox) is the Web Mercator projection. While it is useful for web tiling because it preserves angles (conformal), it is mathematically unsuitable for 3D modeling due to scale distortion. As the distance from the Equator increases, the scale is stretched.
In a 3D environment like Blender, units are Euclidean (1 unit = 1 meter). In Web Mercator, "meters" are distorted relative to the latitude. At 60∘ latitude (e.g., Oslo), a 100-meter real-world distance is represented by 200 units in the projection. If a Digital Elevation Model (DEM) and satellite imagery are not reprojected, the resulting 3D scene will have a 2:1 scale error, leading to vertically exaggerated terrain and incorrect volumes.
Establishing a Shared World Origin
The workflow idea: Set up one appropriate projected CRS at the start of your project and ensure every plugin and exported data file uses it.
Setting a custom CRS allows you to define a specific "Origin" point (zero coordinates) in both QGIS and Blender. This ensures that:
- The center of your 3D world in Blender matches the exact geographic point you defined in your map.
- Data imported from various sources (satellite images, height maps, OSM roads) all align perfectly.
- Ensures that measurements taken within Blender are accurate to Google Earth measurements.
Local Tangent Planes
To achieve accuracy in 3D reconstruction, data must be reprojected into a Topocentric system or a Local Tangent Plane.
-
UTM (Universal Transverse Mercator): Divides the Earth into 60 narrow zones. Within these zones, distortion is minimized to less than 0.1%, making it the standard for local 3D site reconstruction.
-
Azimuthal Orthographic: This projection views the Earth as a tangent to a specific point on the surface. By centering the projection on your specific 3D scene's origin, you eliminate the Mercator distortion.
This ensures that the (x,y,z) coordinates in Blender represent a true 1:1 physical relationship with the real-world site.
UTM (Universal Transverse Mercator)
Tools: Use epsg.io to search for coordinate systems and find the EPSG code for the area you will be working on.
Find your zone based on your project's longitude, and use that zone's CRS. For example:
- Milan, Italy is in UTM Zone 32N (EPSG:32632)
- New York, USA is in UTM Zone 18N (EPSG:32618)
- Tokyo, Japan is in UTM Zone 54N (EPSG:32654)
DEM (Digital Elevation Models)
A Digital Elevation Model is essentially a grayscale image (usually called a height map) where brightness represents height. Darker values are lower elevations, brighter values are higher elevations. When imported into Blender, these can be converted into actual 3D terrain geometry. Using the Open Topography plugin allows us to access various DEM sources.
Resolution
Free DEM sources typically offer 30-meter resolution at best. This means that for every 30m × 30m square of ground, you get a single height value. For small sites like individual buildings or small plazas, this provides very limited elevation detail. You're essentially getting the "average" height of a tennis-court-sized area.
Practical implication: When working with free DEM data, plan to capture a larger area that includes surrounding terrain context. If you're reconstructing a 100m town square, consider working with a 2-3 km area so the terrain model shows how the square sits within hills, valleys, or the broader urban landscape. The DEM provides regional context, not site-specific detail.
Higher resolution alternatives: LiDAR data can provide sub-meter resolution but is typically expensive and not globally available. Some regions have 10m or better DEM from national mapping agencies, but coverage is inconsistent.
Scale and Units
In Blender, we work in "Blender Units" which we typically set to represent meters. When importing geospatial data, we need to ensure:
- Blender is set to metric units (Scene Properties > Units > Metric)
- The scale is 1:1 (1 Blender unit = 1 meter)
- BlenderGIS is configured to match the CRS of your imported data If everything is set up correctly, a road that's 10 meters wide in reality will be 10 Blender units wide in your scene. This real-world scale is essential for accurate reconstruction.
Temporal Considerations
Different data sources capture imagery at different times.
Satellite imagery from services like Google or Bing is typically a composite—different areas may be from different dates, usually stitched together from the clearest available images. The capture date might be months or years before you're viewing it. I have not been able to figure out how to have QGIS show when specific satellite images were taken. When using Google satellite images you can look up the date in Google Earth Pro, where you can also use the historical imagery timeline slider to see how the area has changed over time and select imagery from the correct period.
Baseline Workflow
This workflow was inspired by this video. I've adjusted it slightly for flow and to better suit our needs. The main idea is to quickly set up a geospatial "base map" in QGIS that can serve as the foundation for reconstruction in Blender. This base map includes a satellite image, a custom CRS centered on our site, and an origin point. Once this is set up, we can add additional layers (building footprints, roads, DEM) that will all align perfectly with each other and with Blender.
Establishing a base map
### Setting up a Base map
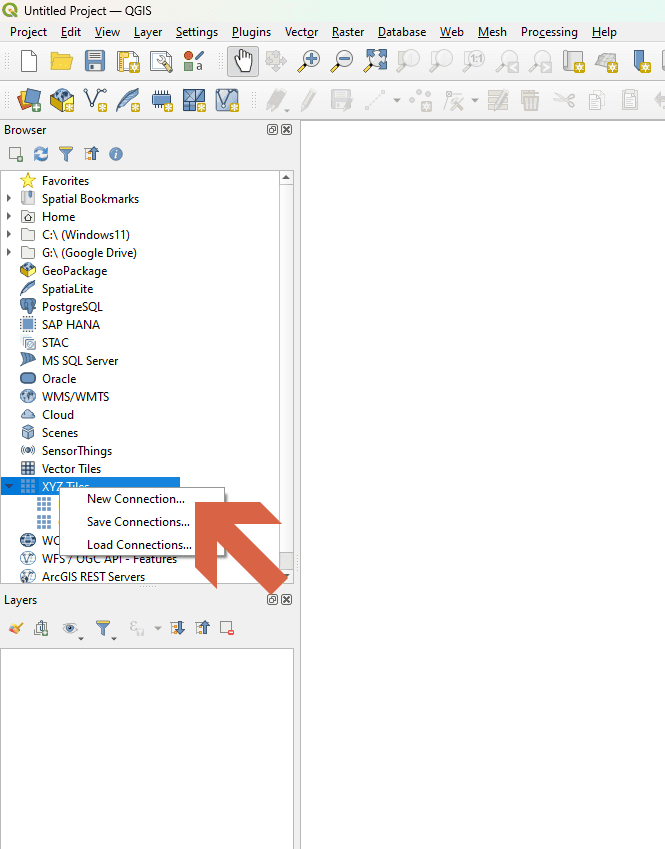
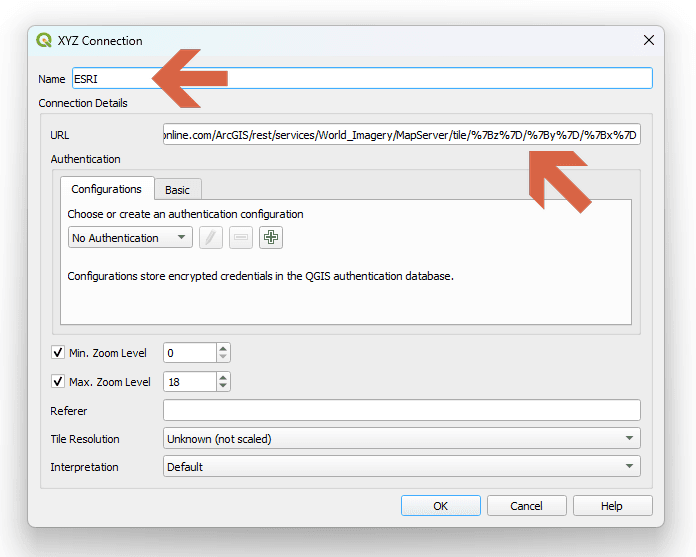
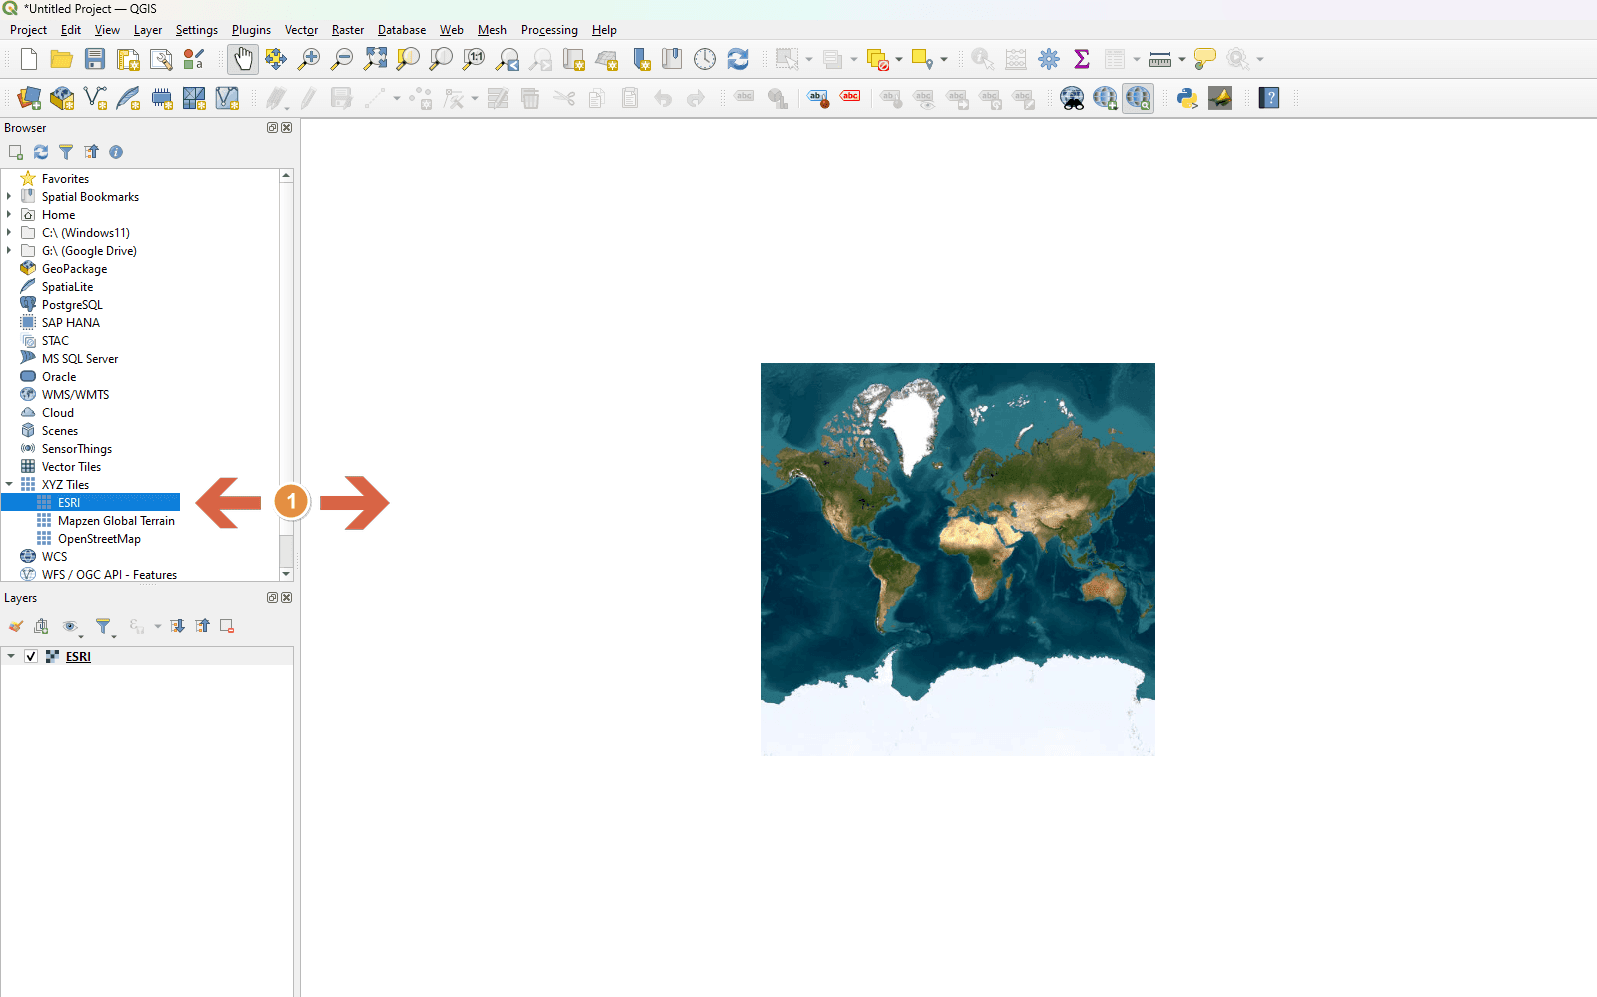
Set up QuickMapServices and add a satellite basemap (Google Satellite Hybrid is a good choice).
https://server.arcgisonline.com/ArcGIS/rest/services/World_Imagery/MapServer/tile/%7Bz%7D/%7By%7D/%7Bx%7D
Setting up the CRS
Setting up the CRS
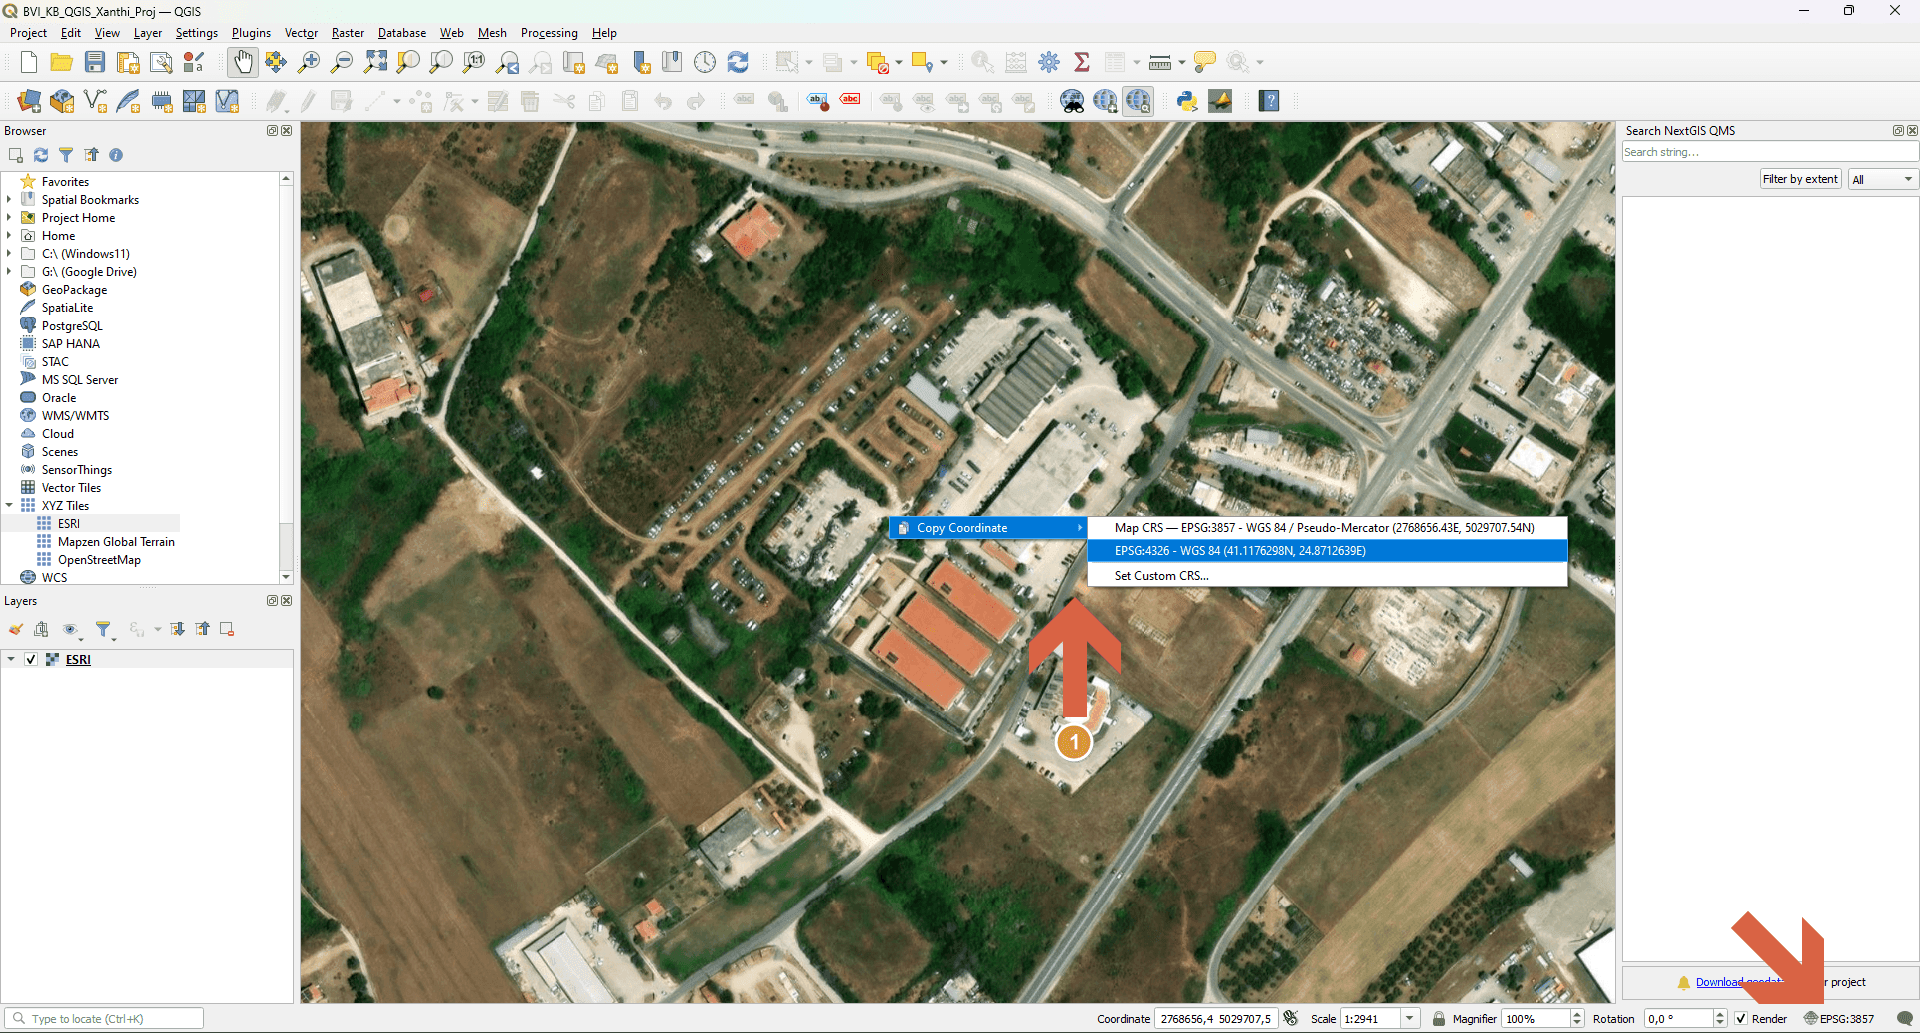
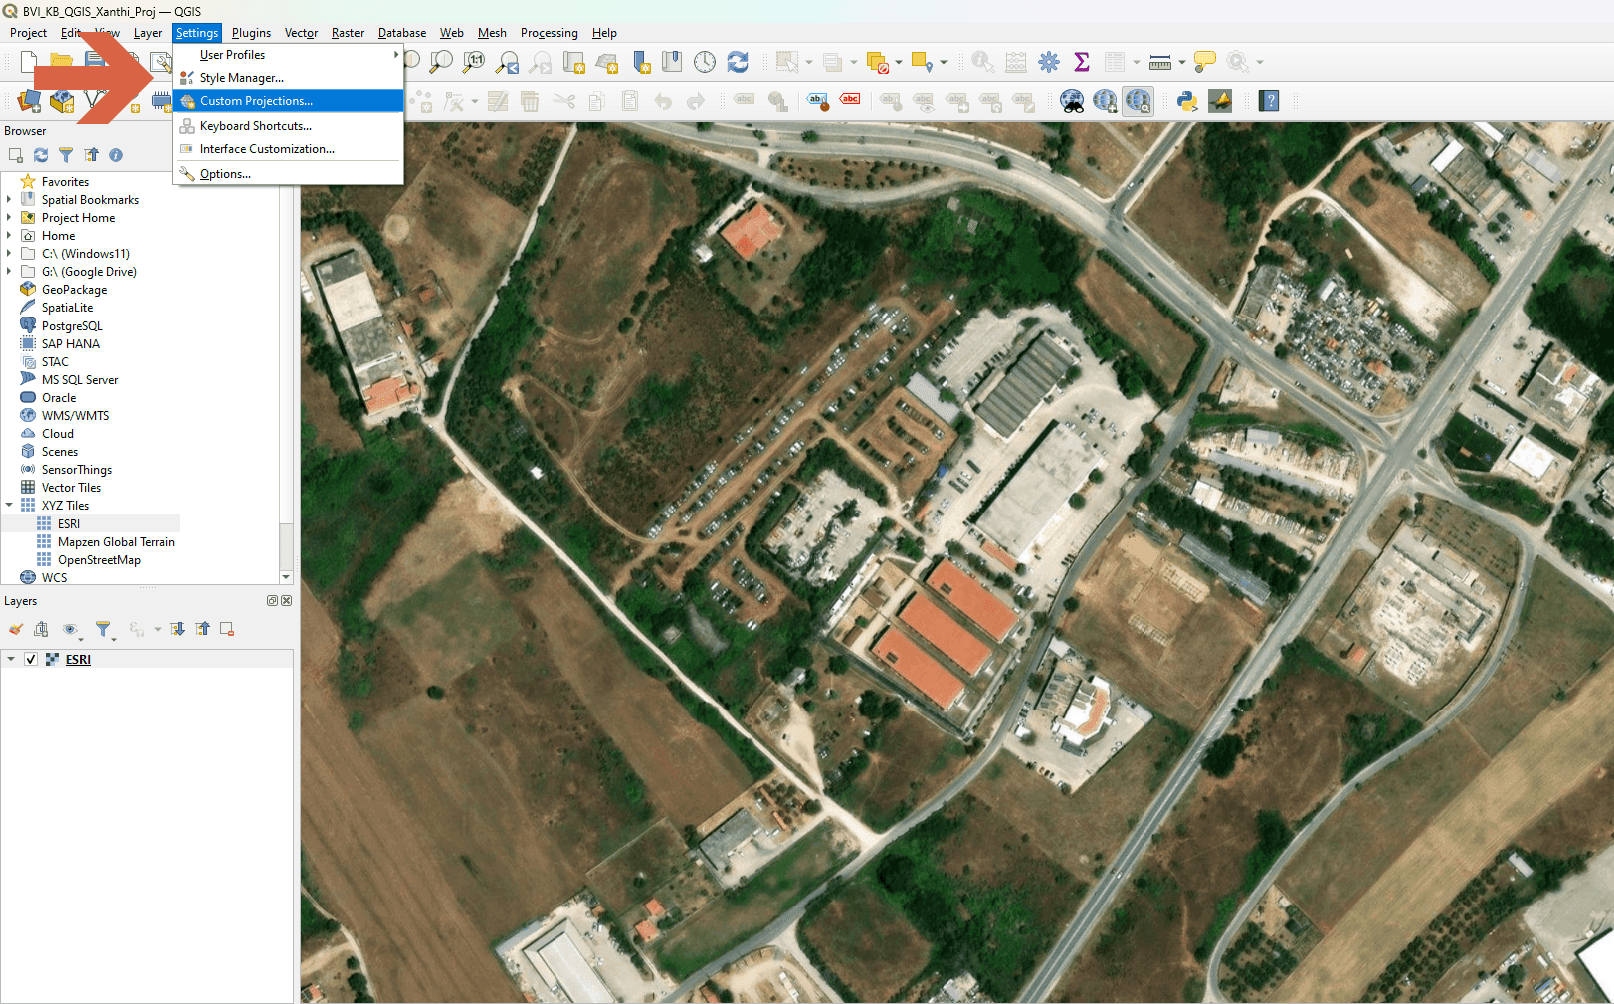
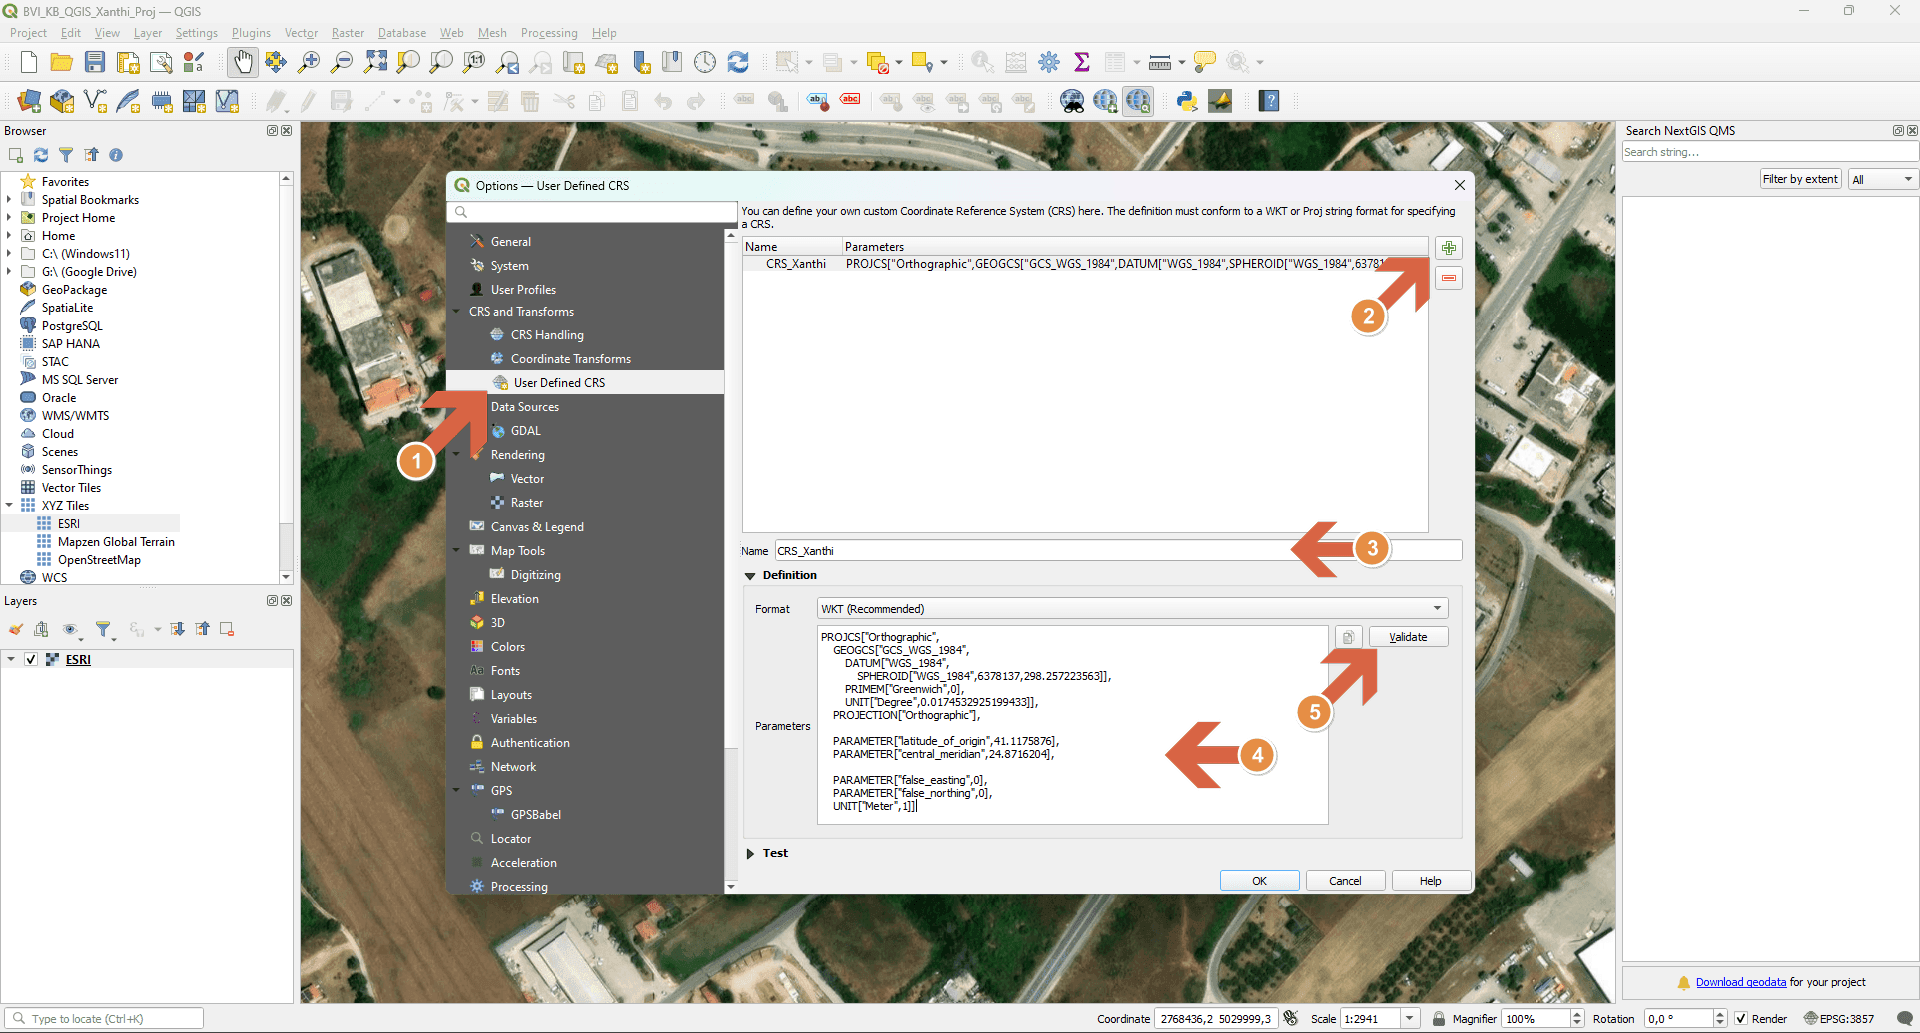
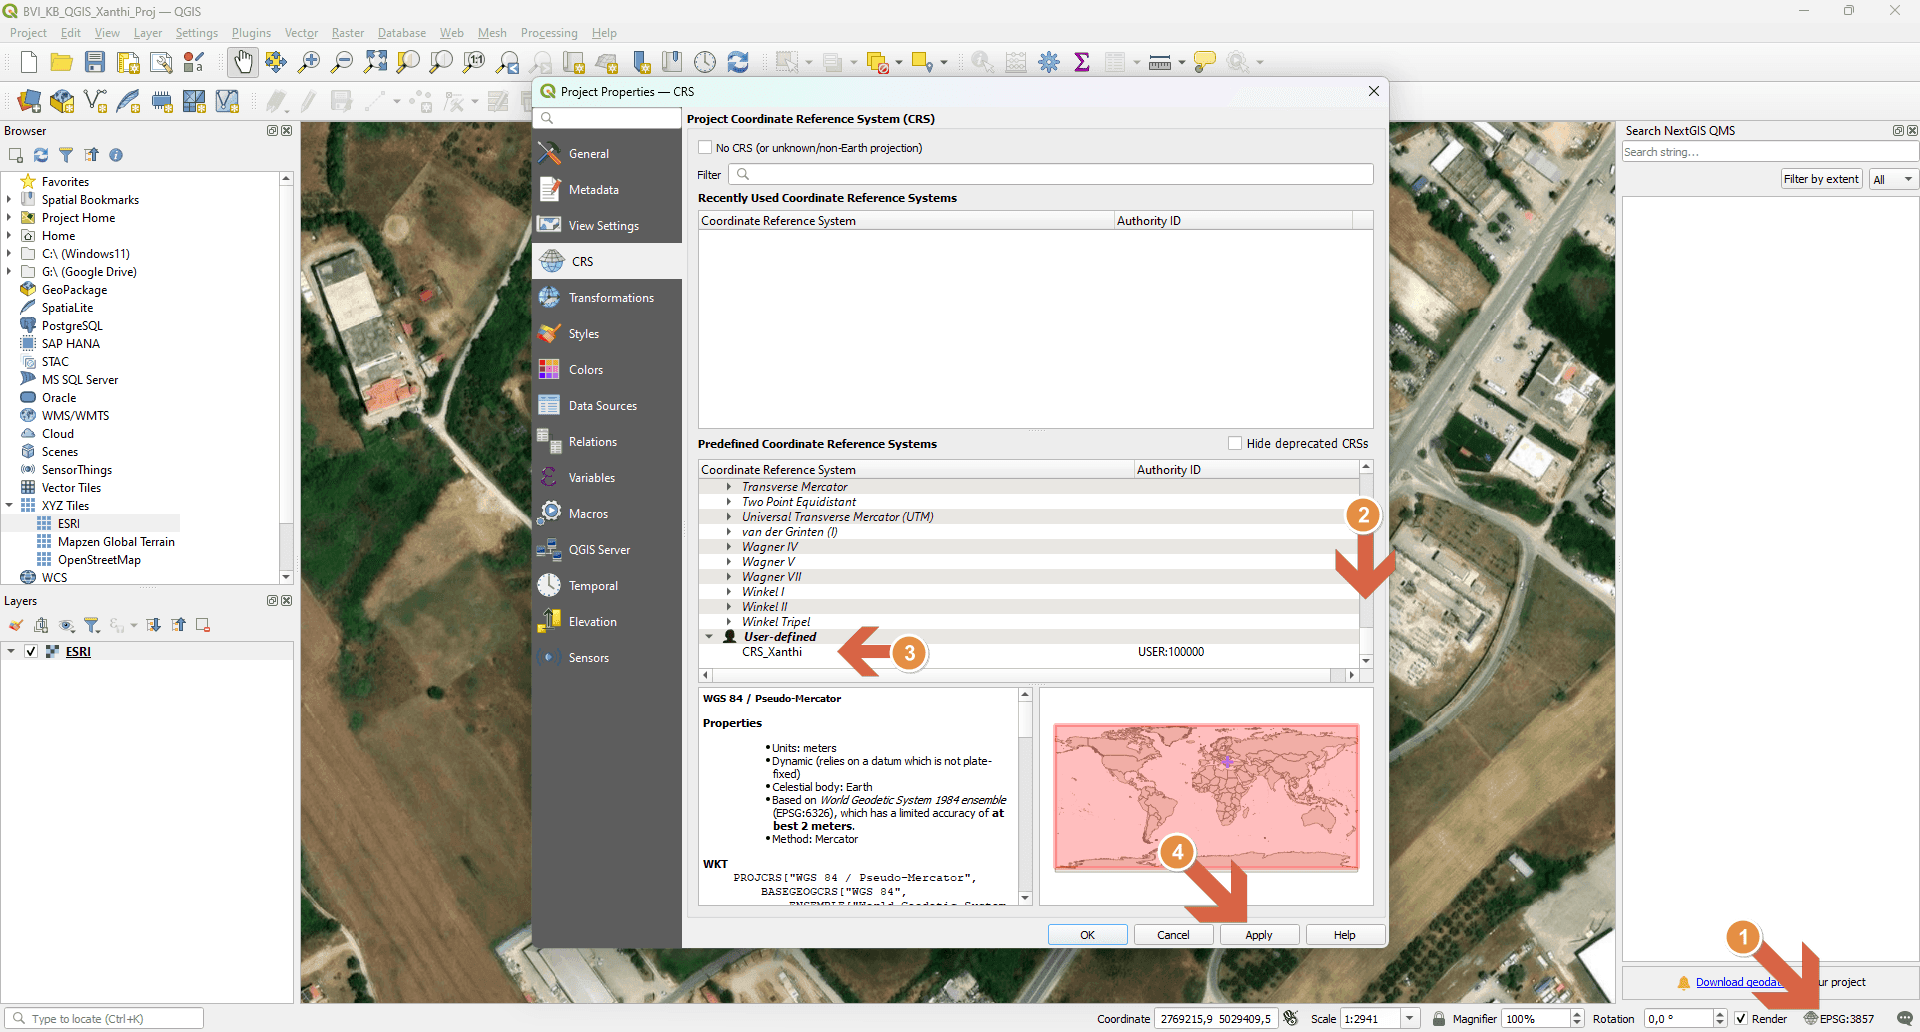
Follow the steps in the images above to set up a custom CRS centered on your area of interest. In the parameters, use the following template, replacing the latitude and longitude values with those copied from your location:
PROJCS["Orthographic",
    GEOGCS["GCS_WGS_1984",
        DATUM["WGS_1984",
            SPHEROID["WGS_1984",6378137,298.257223563]],
        PRIMEM["Greenwich",0],
        UNIT["Degree",0.0174532925199433]],
    PROJECTION["Orthographic"],

    PARAMETER["latitude_of_origin",<Your Latitude>],
    PARAMETER["central_meridian",<Your Longitude>],

    PARAMETER["false_easting",0],
    PARAMETER["false_northing",0],
    UNIT["Meter",1]]
Setting up an Origin Point
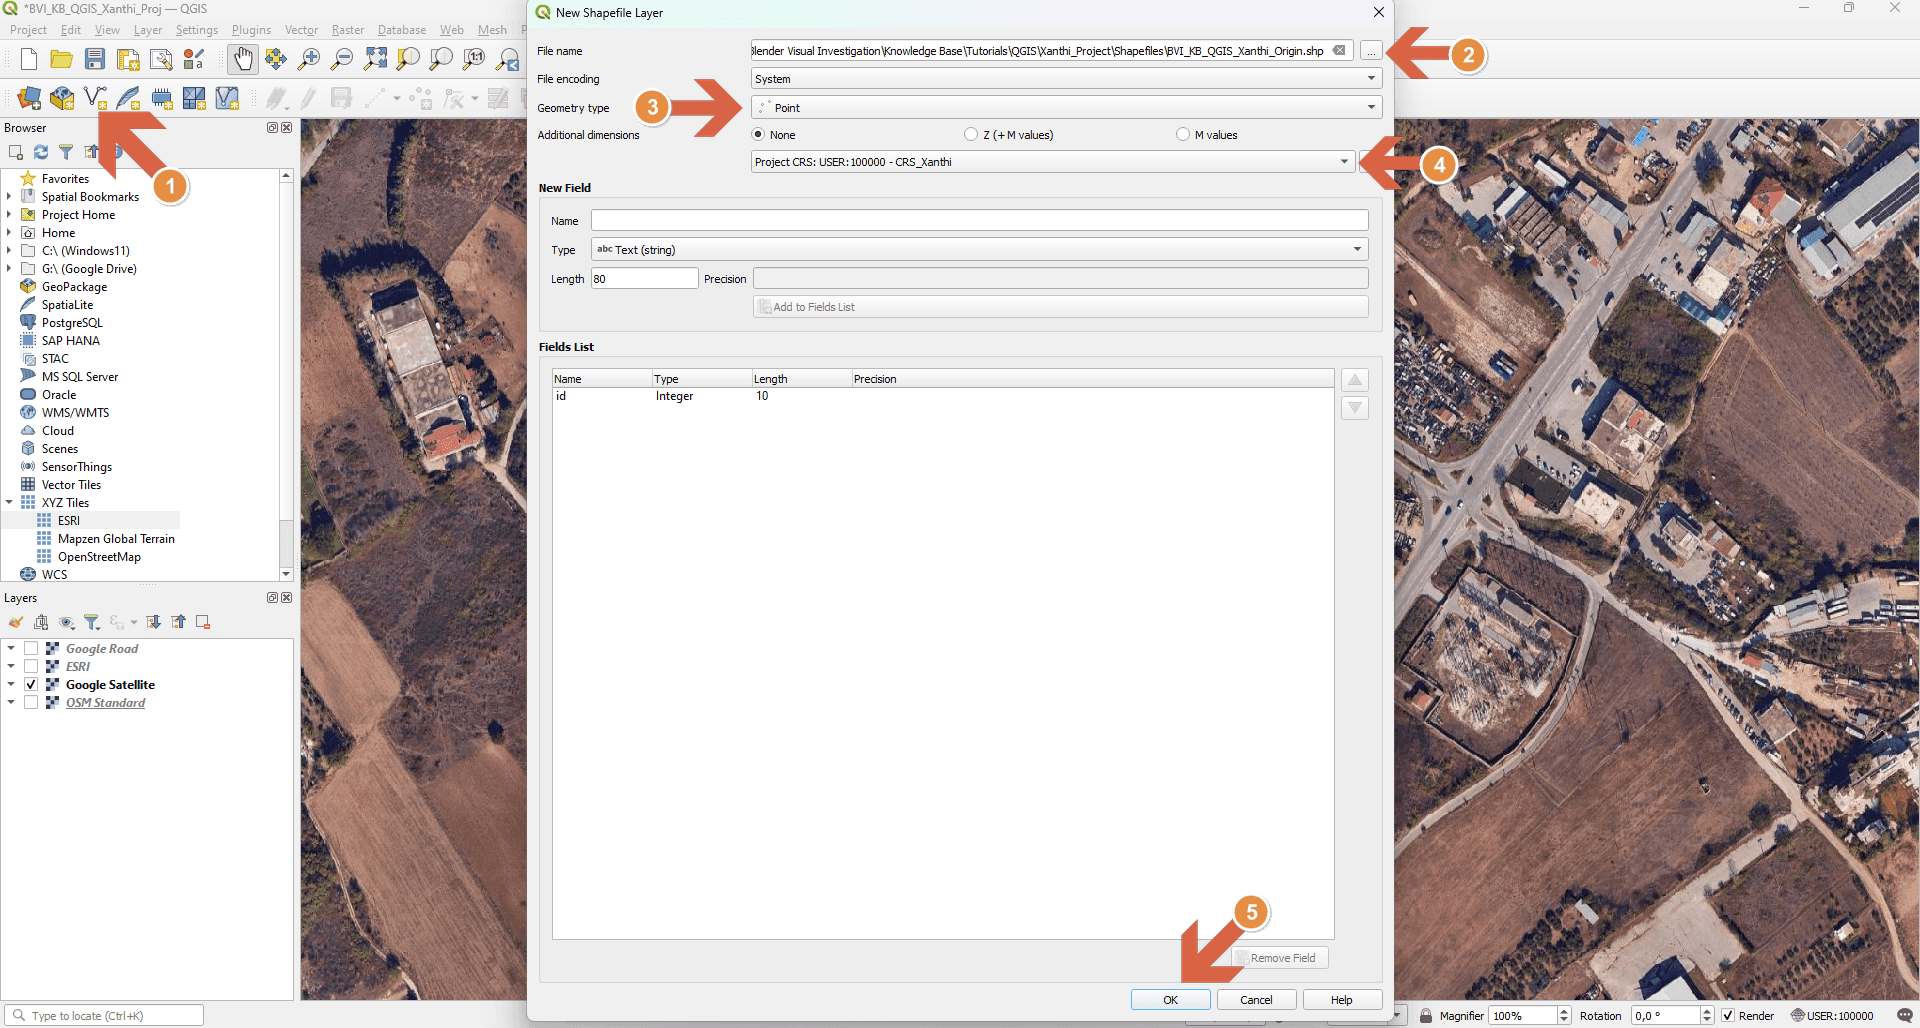
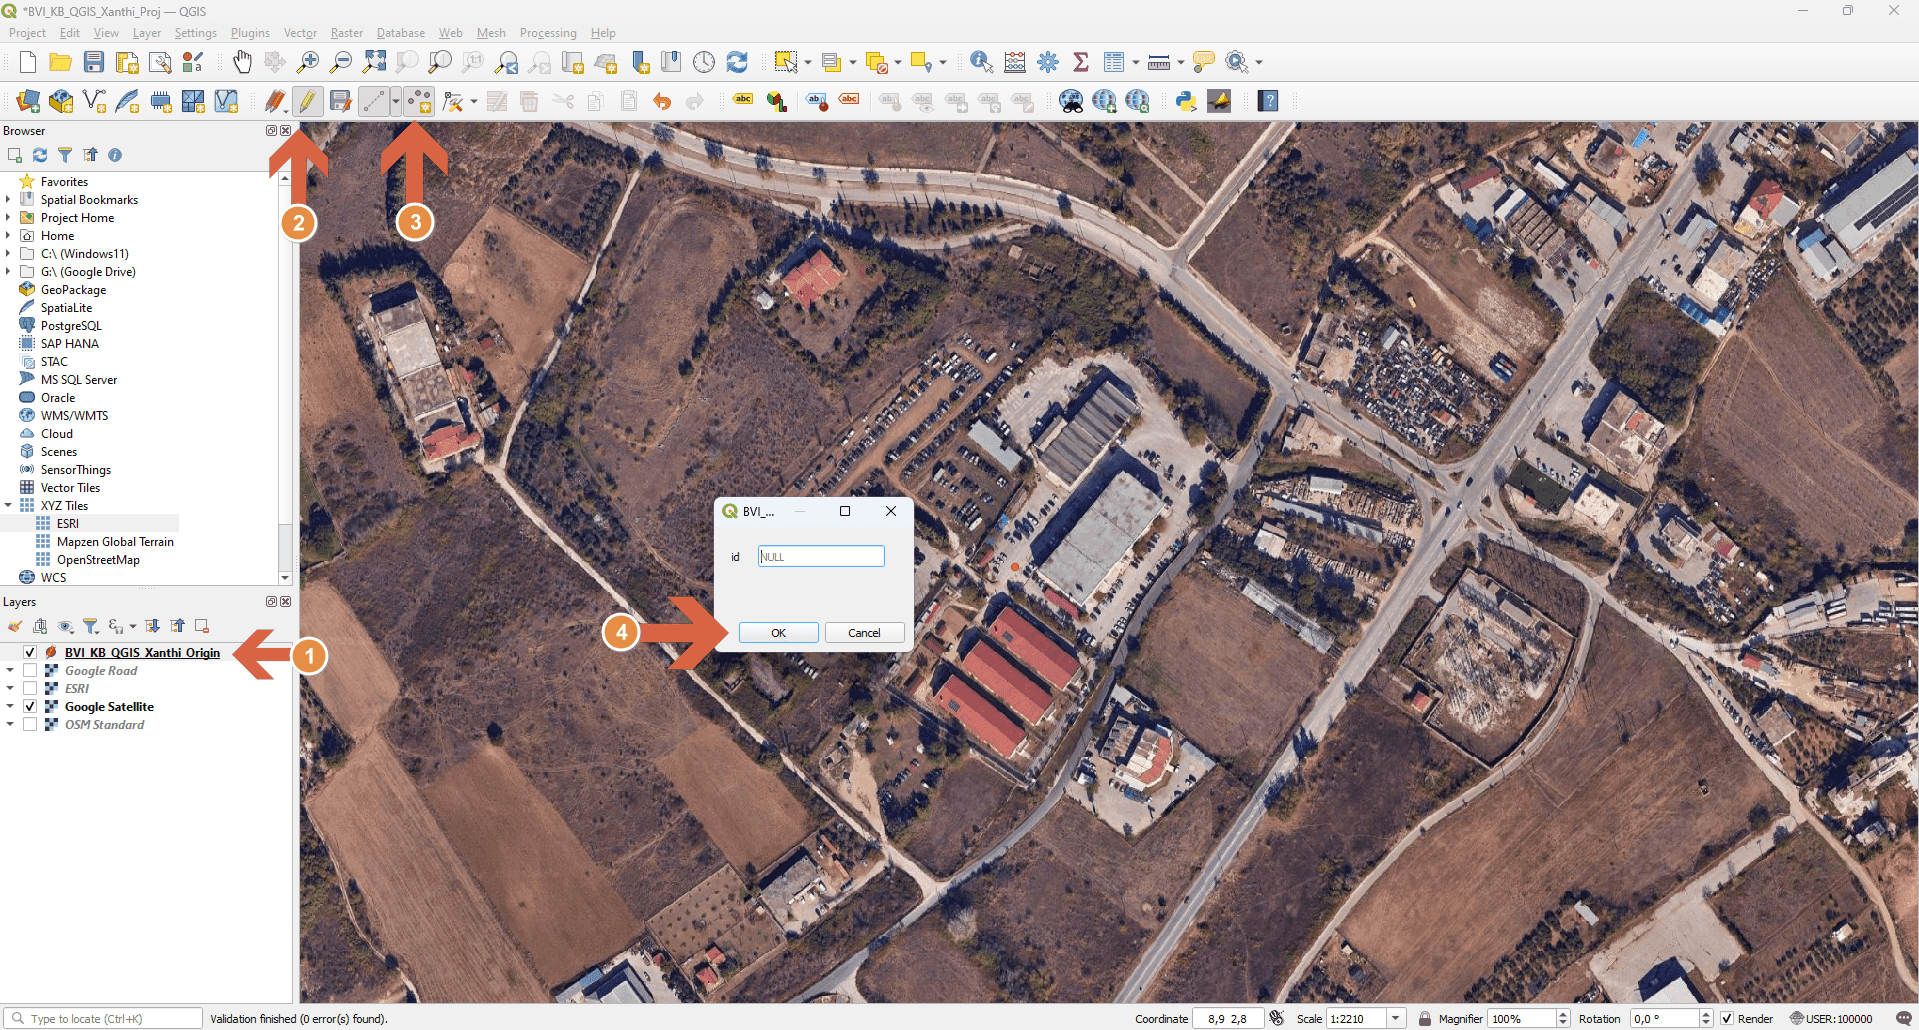
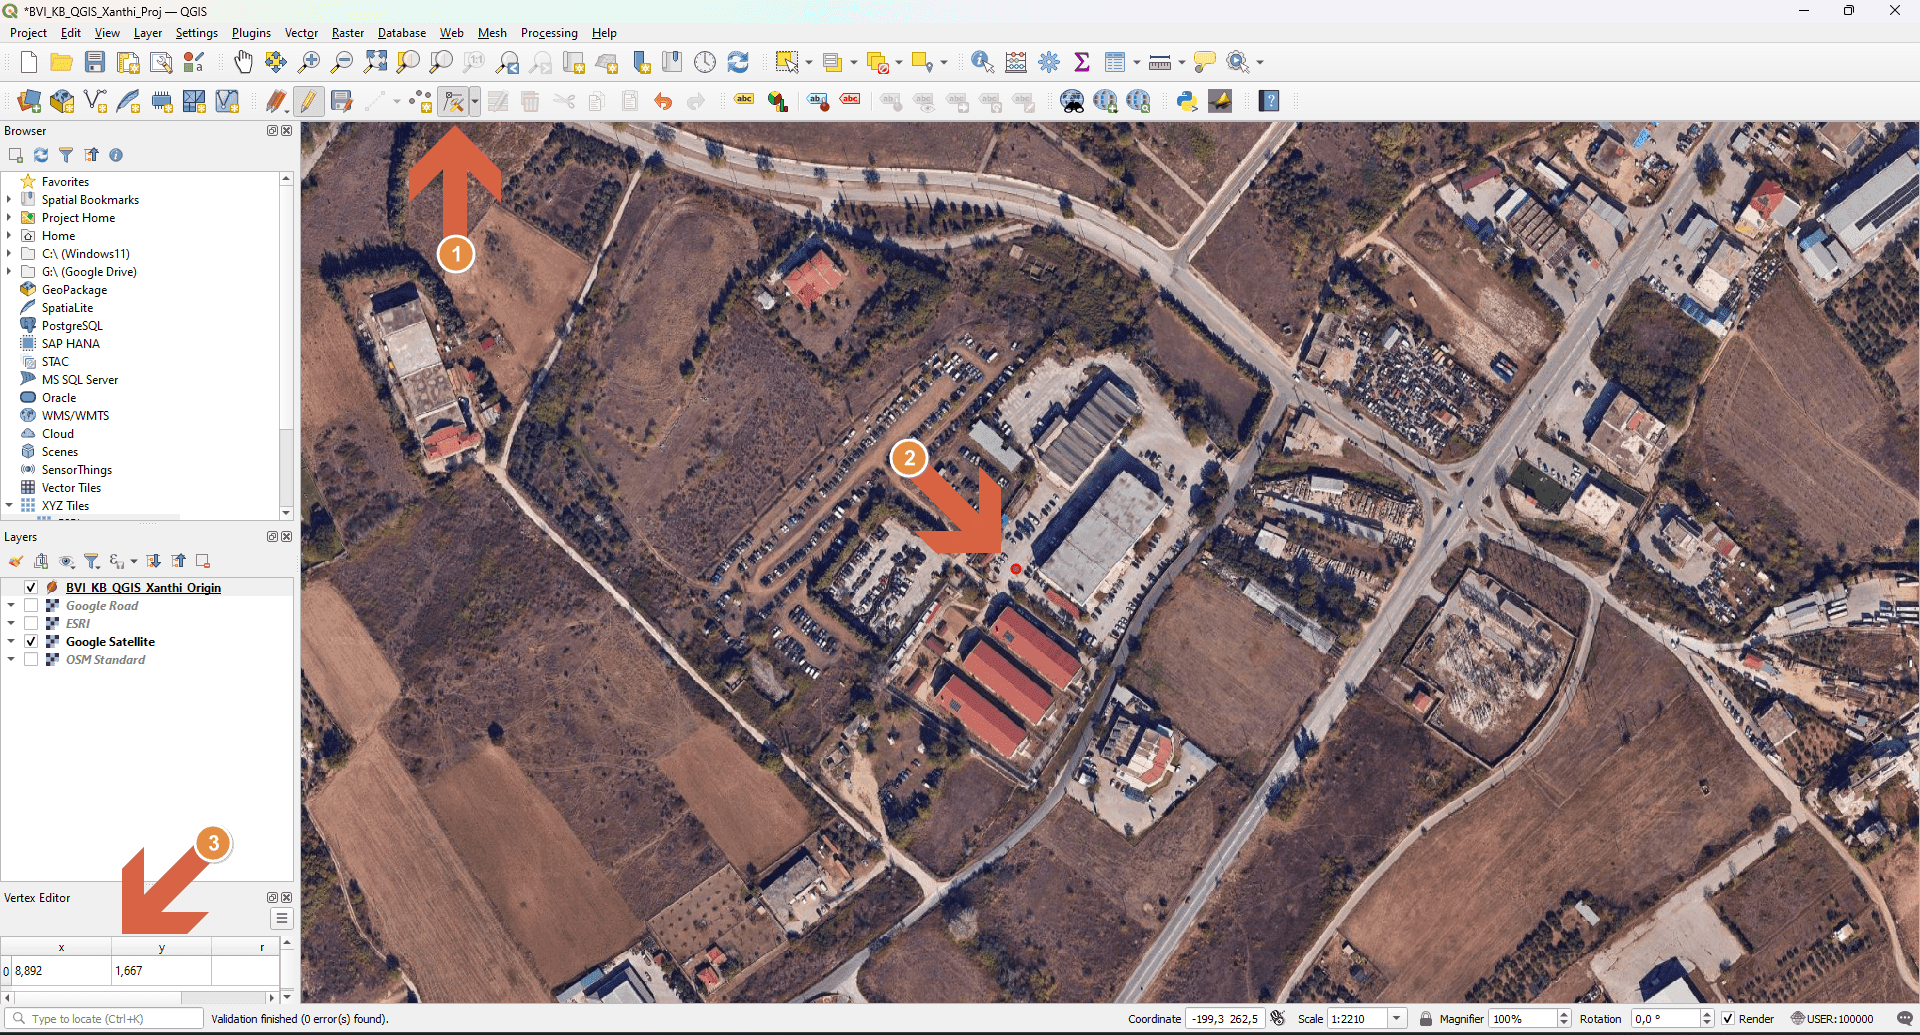
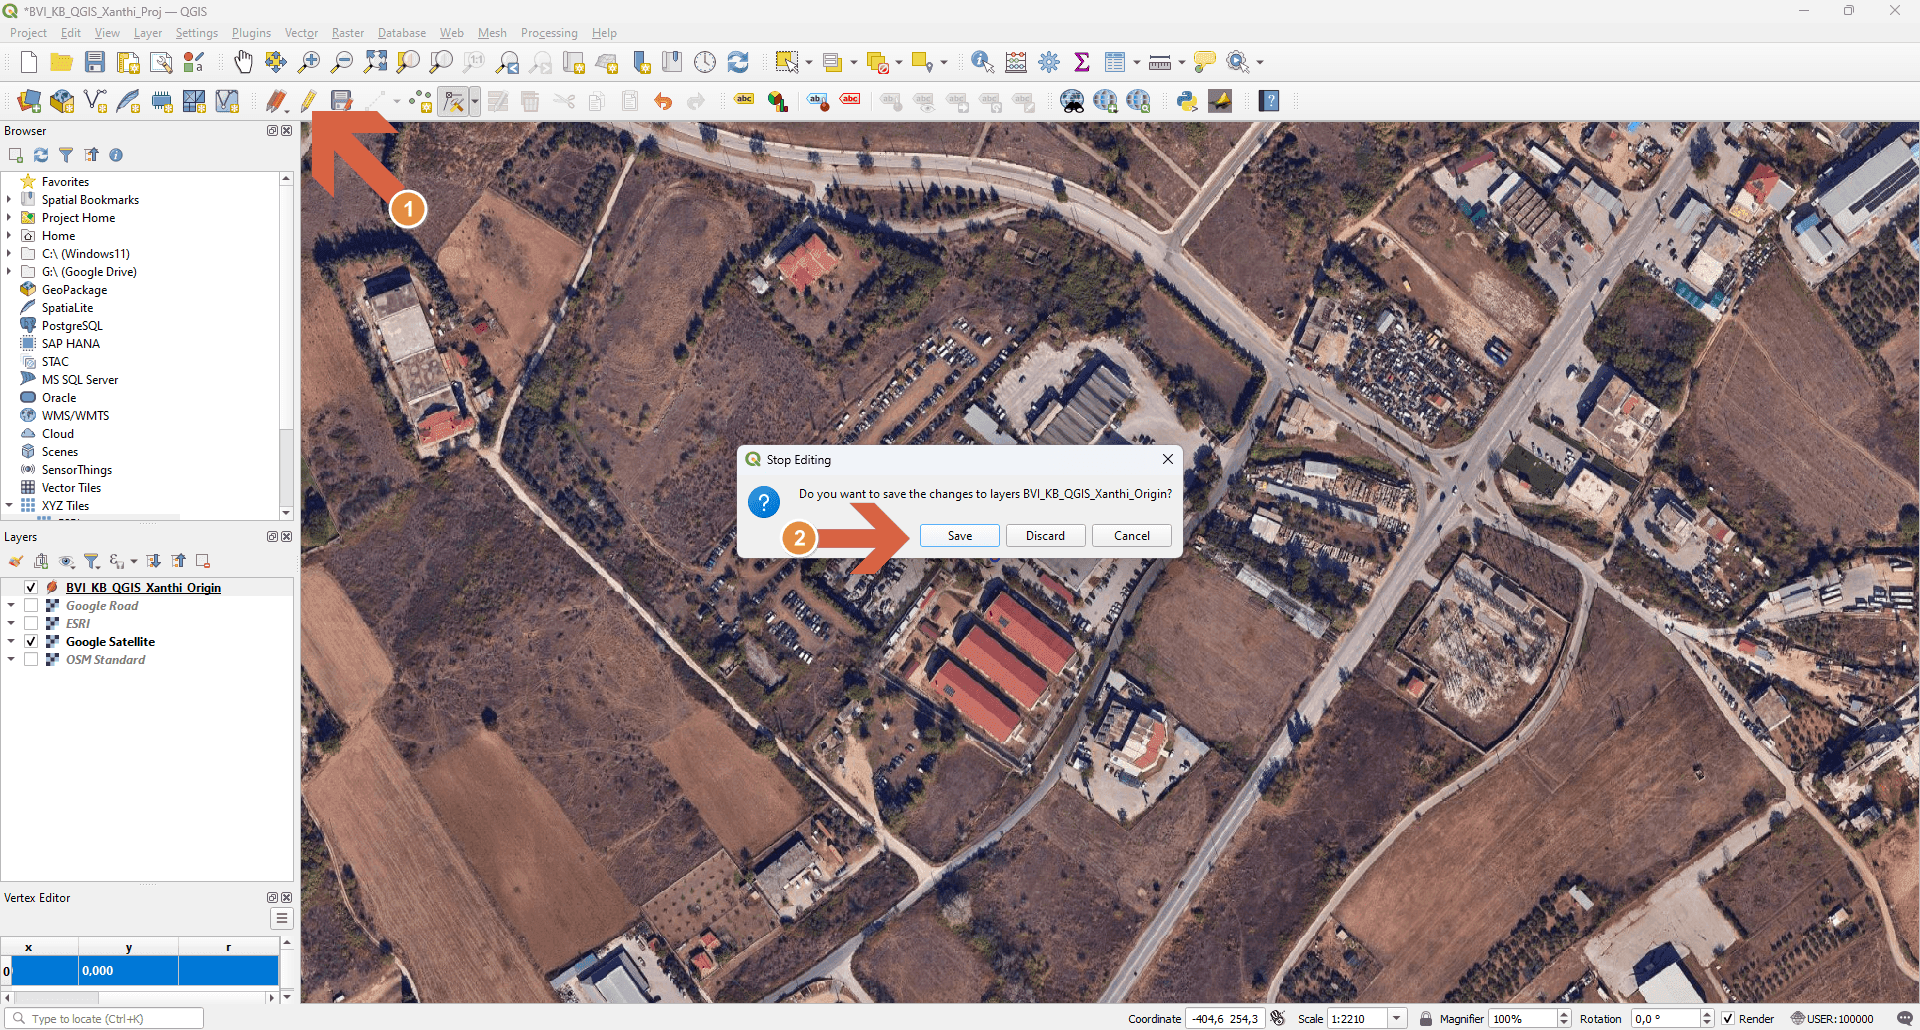
Setting up an origin point helps in aligning your data correctly in Blender. Follow the steps in the images above to create a point layer at your desired origin location. This point will serve as a reference when exporting data to Blender.
Setting up Capture Regions
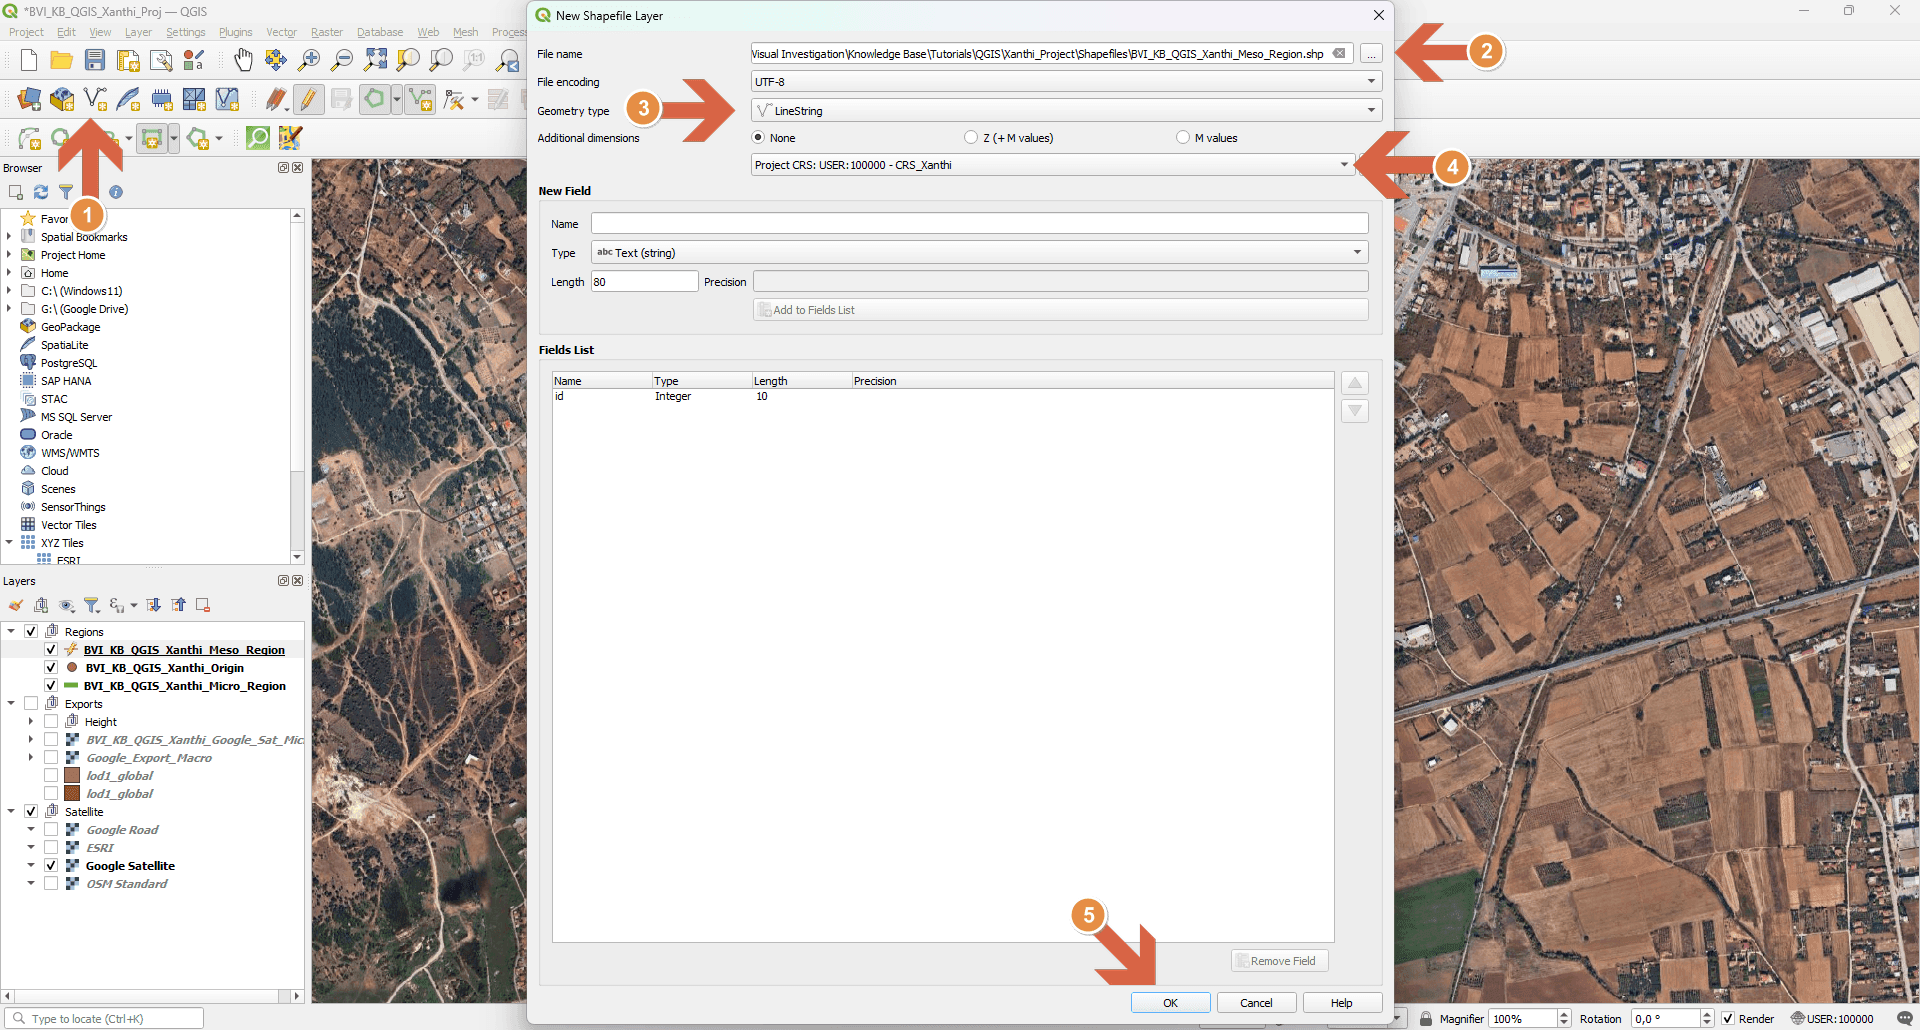
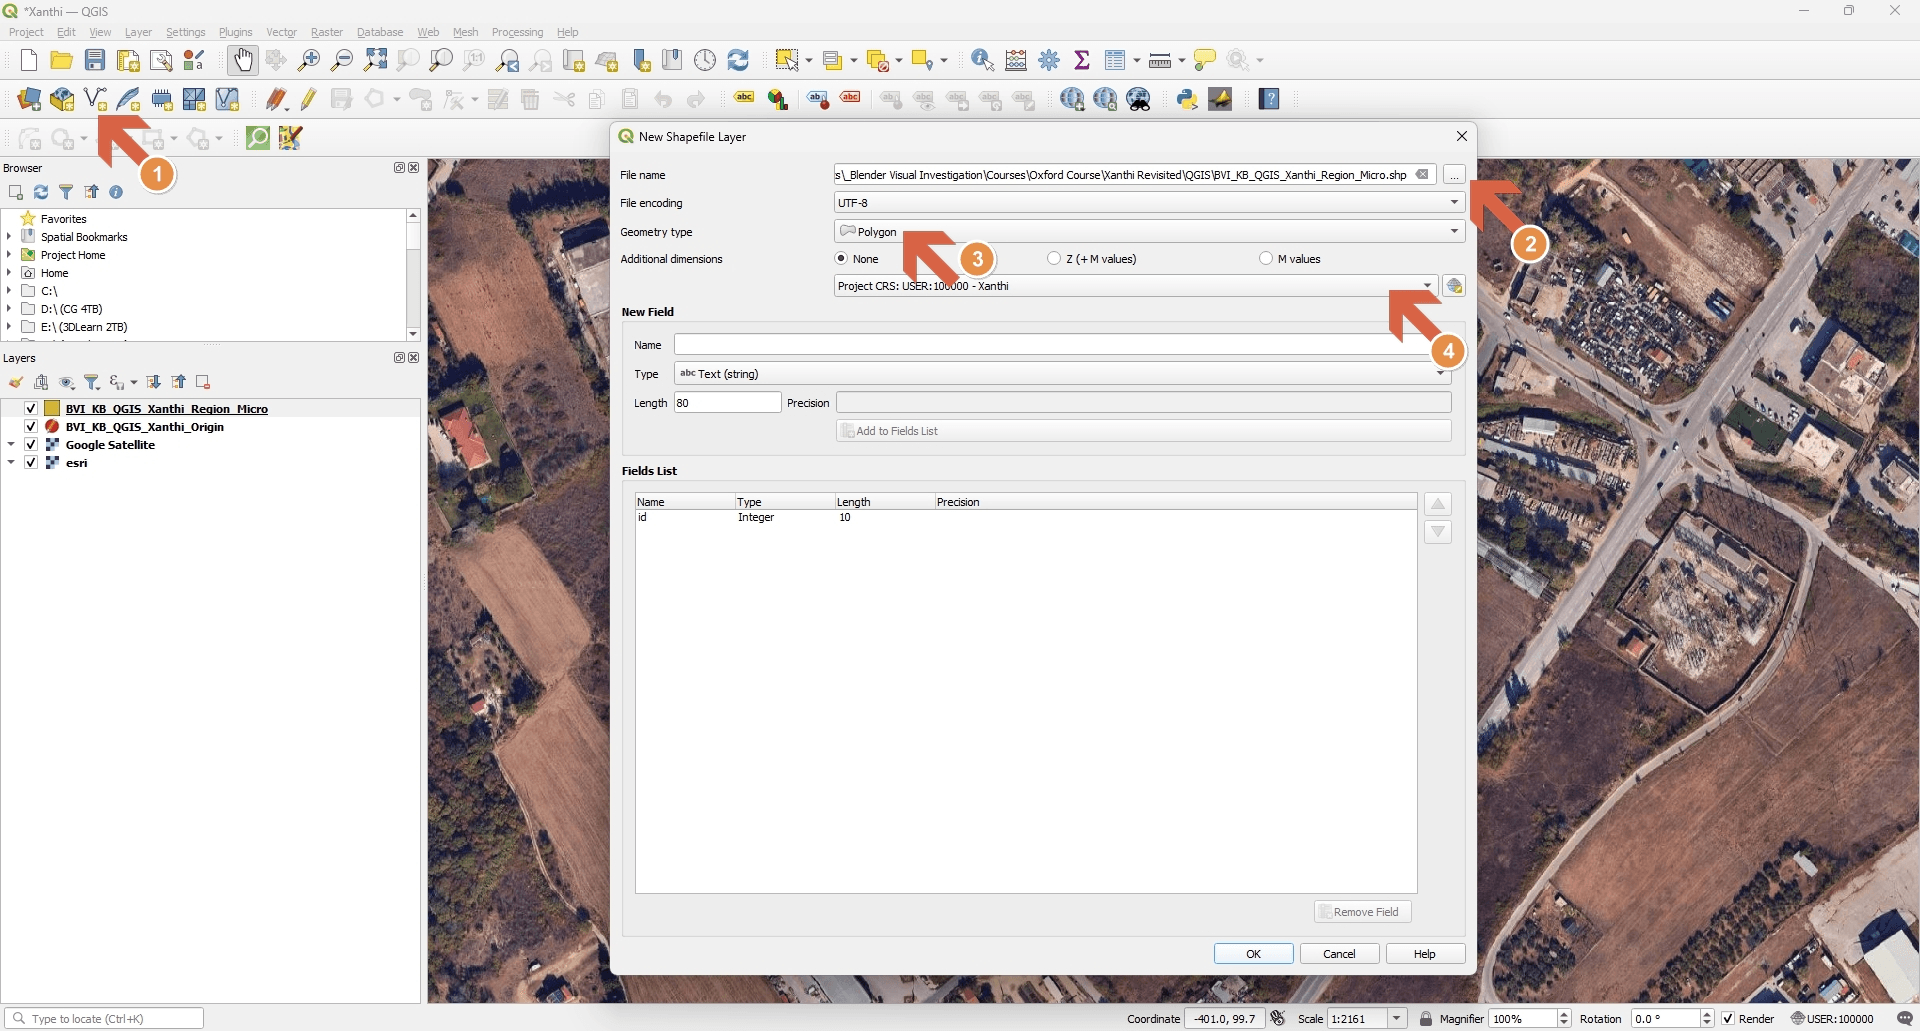
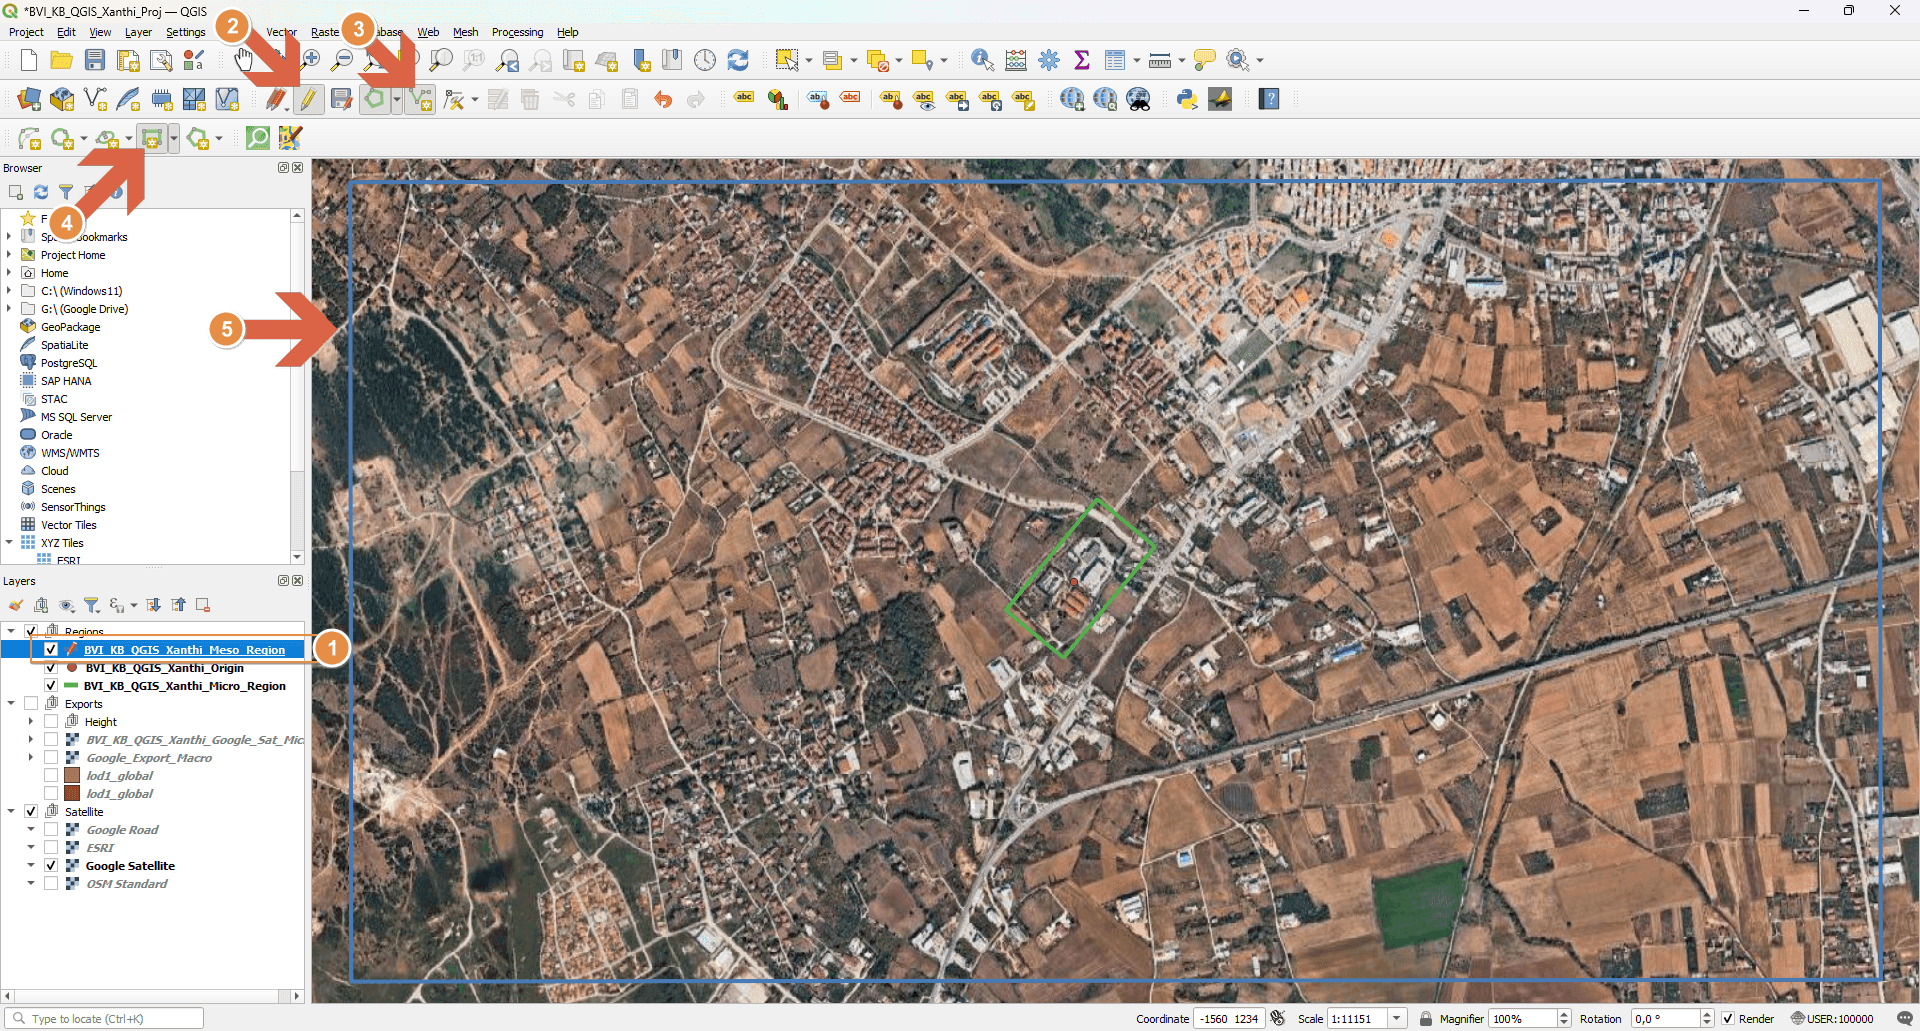
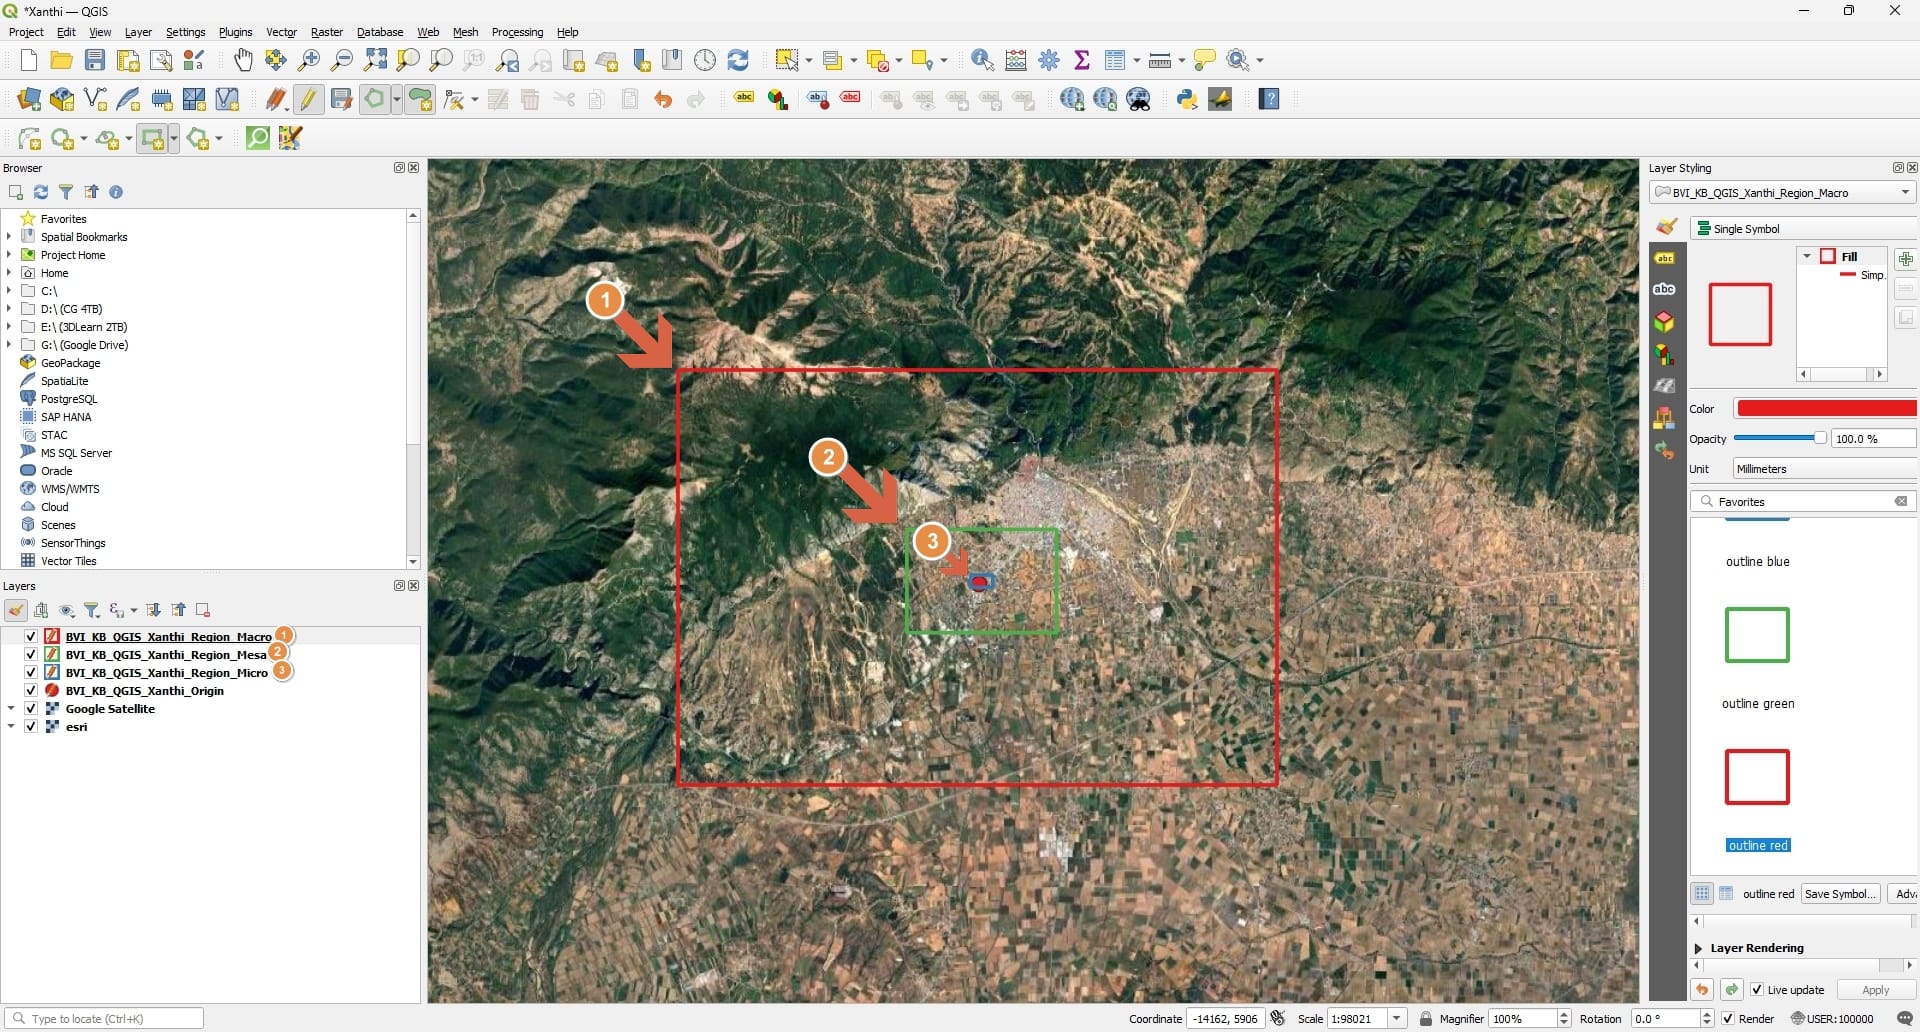
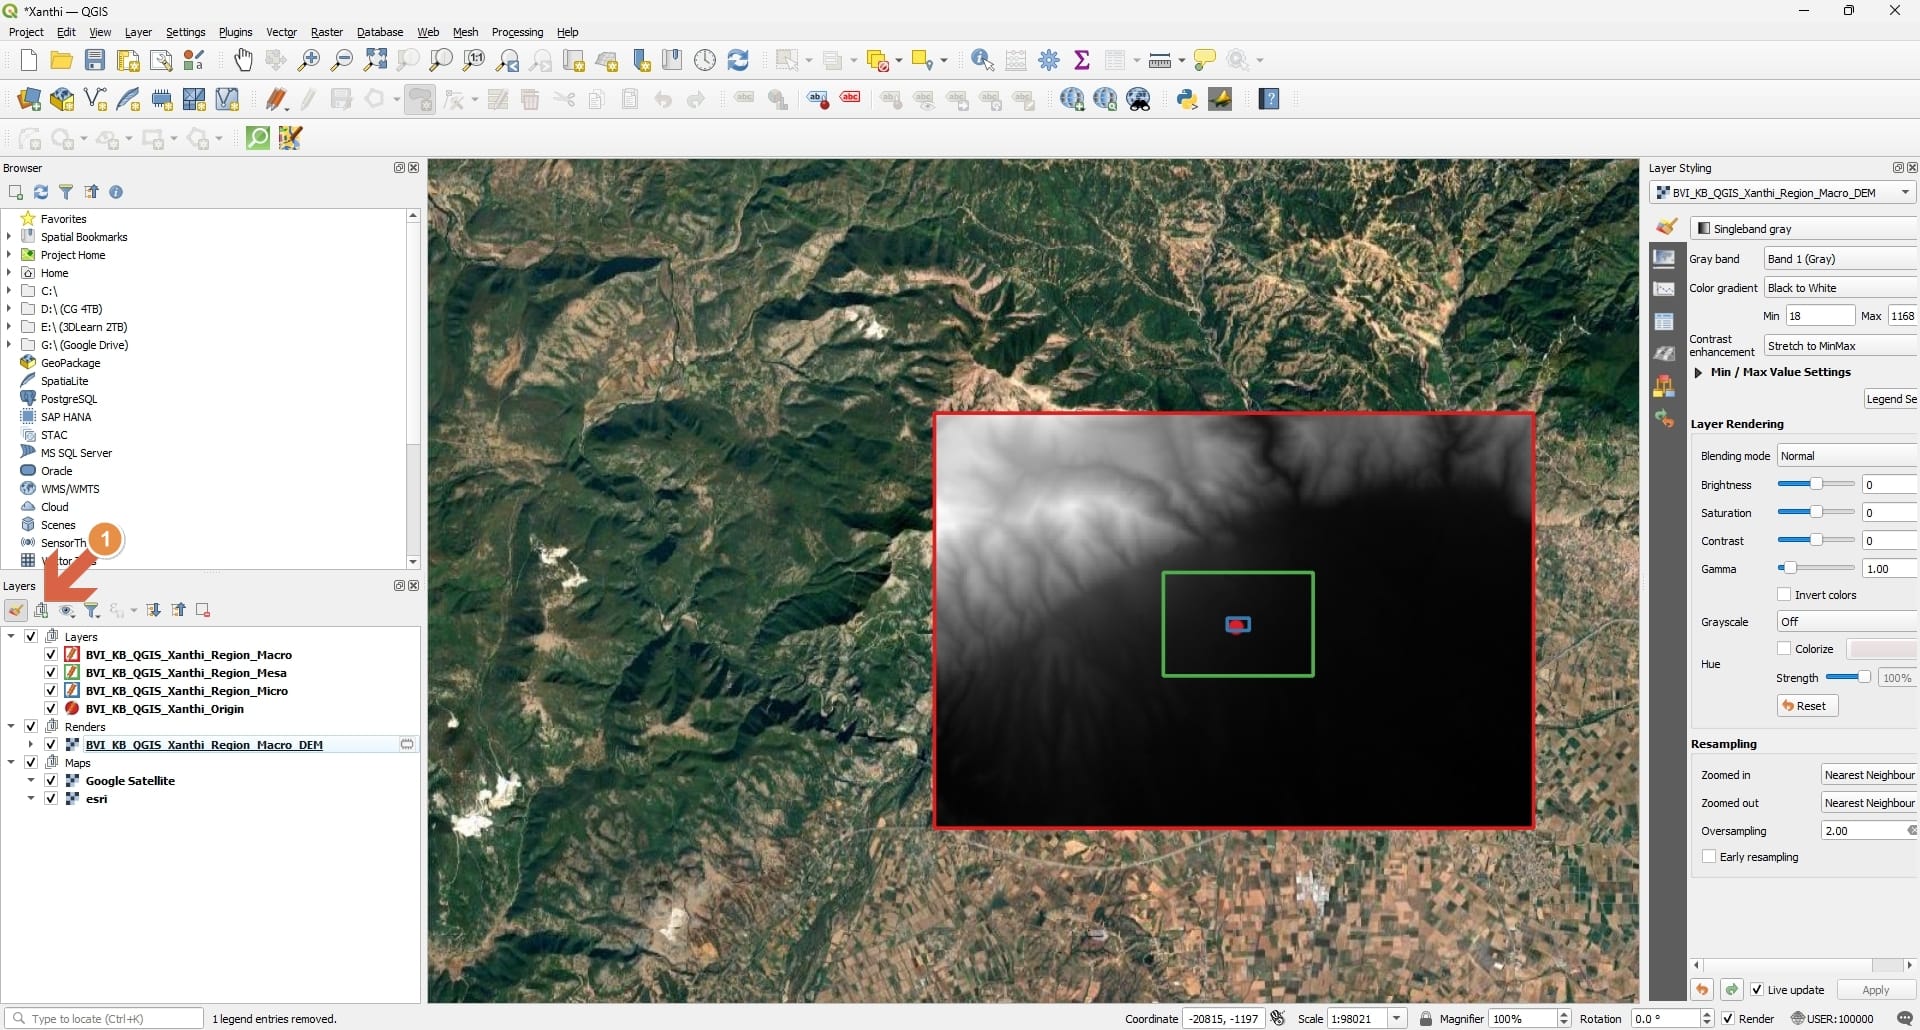
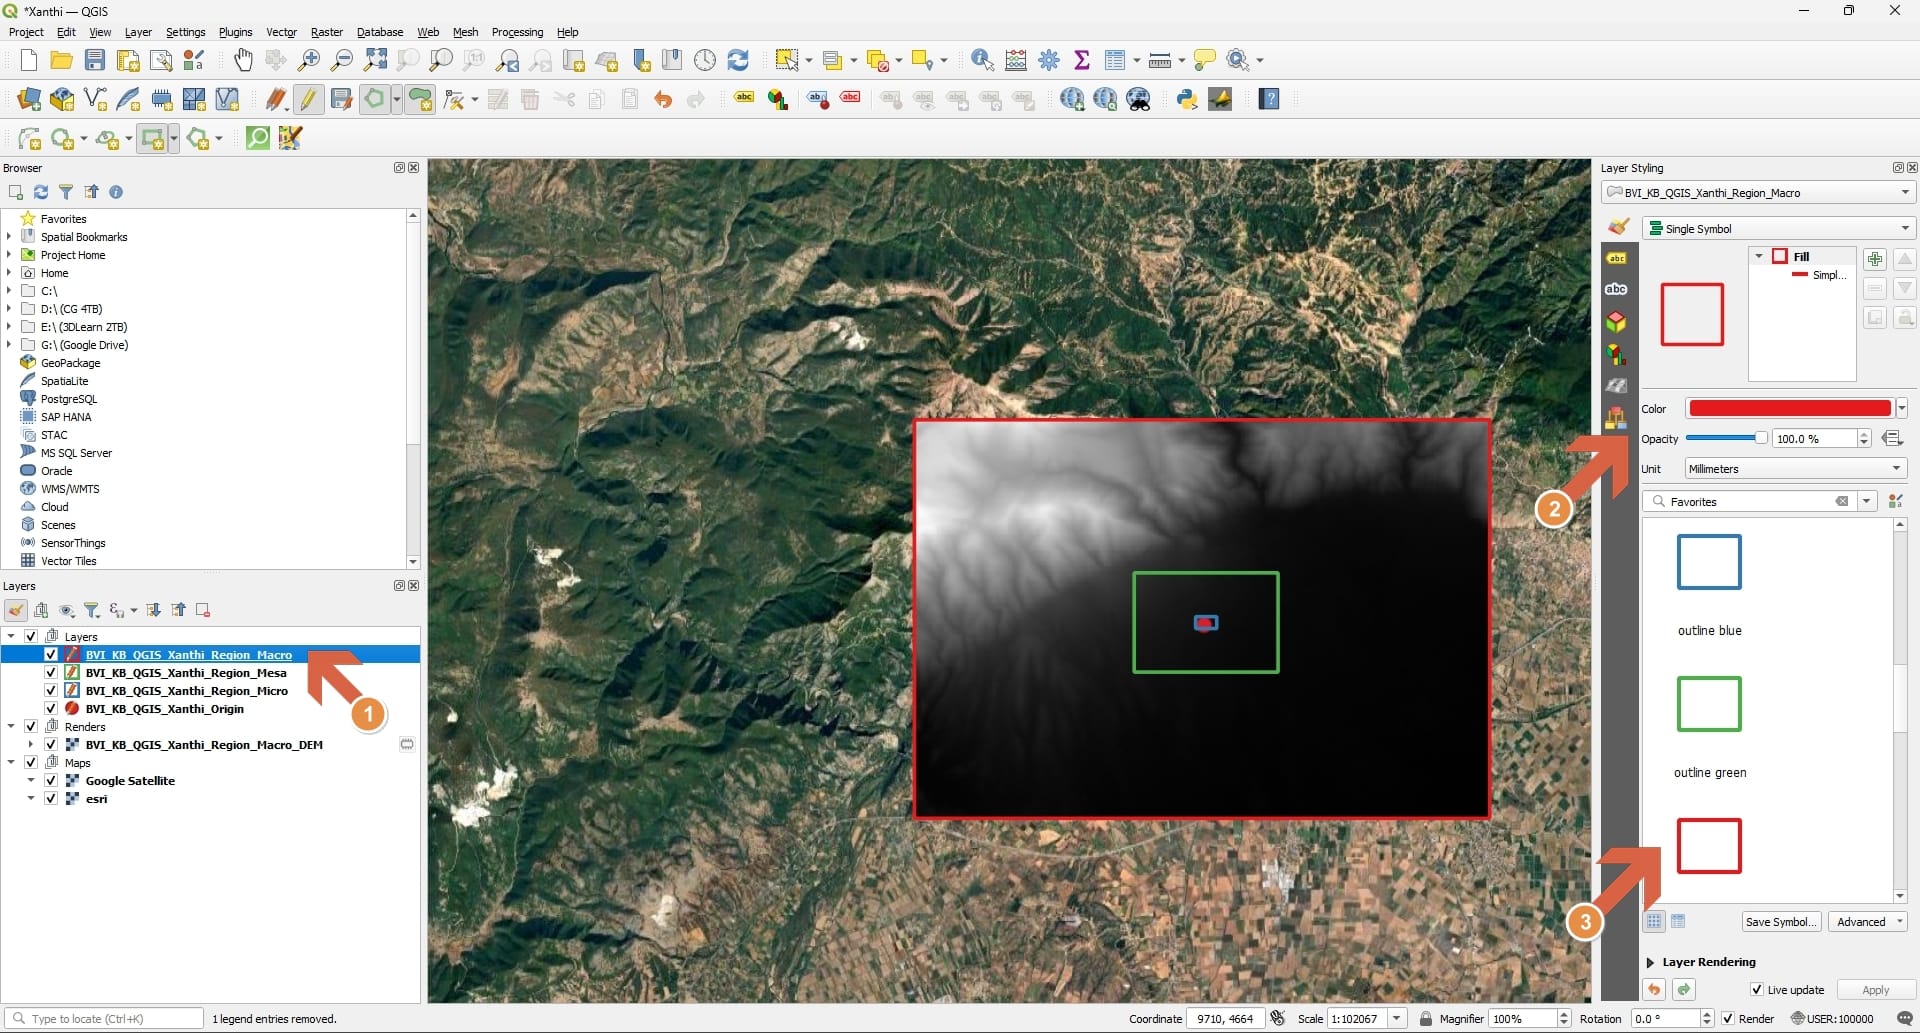
I like to set up micro, mesa, and macro capture regions as layers in QGIS to help me visualize the area I need to cover with different data types. It also makes it easier to export data for specific areas later on.
Data Acquisition
There are many types of data you can acquire in QGIS. The following I consider ones that will provide a solid foundation.
Basemap Services
Plugins: QuickMapServices
Basemaps are background map layers from a wide range of online services. They're a primary source for satellite imagery and street maps.
Setting up QuickMapServices:
Go to Web → QuickMapServices → Settings Click the "More services" tab Click "Get contributed pack" to access additional providers Now you can access basemaps via: Web → QuickMapServices → [Provider] → [Map Type]
Key Providers:
- Google Satellite/Hybrid (High-resolution satellite imagery, "Hybrid" includes road labels overlaid on satellite imagery) Best coverage in urban and developed areas Cannot be directly exported (terms of service), but can be captured for reference
- Bing Aerial (Microsoft's satellite imagery) Sometimes has better or more recent coverage than Google in certain regions Different capture dates than Google, it’s worth comparing
- Esri World Imagery (Composite from multiple sources, Good global coverage, Often used as a baseline)
Comparing sources: Load multiple basemap providers in QGIS as different layers and toggle visibility to compare. You might find Google has better resolution in one area, while Bing has more recent imagery in another. Different capture dates also mean different seasons, lighting, and site conditions.
Elevation Data (DEM)
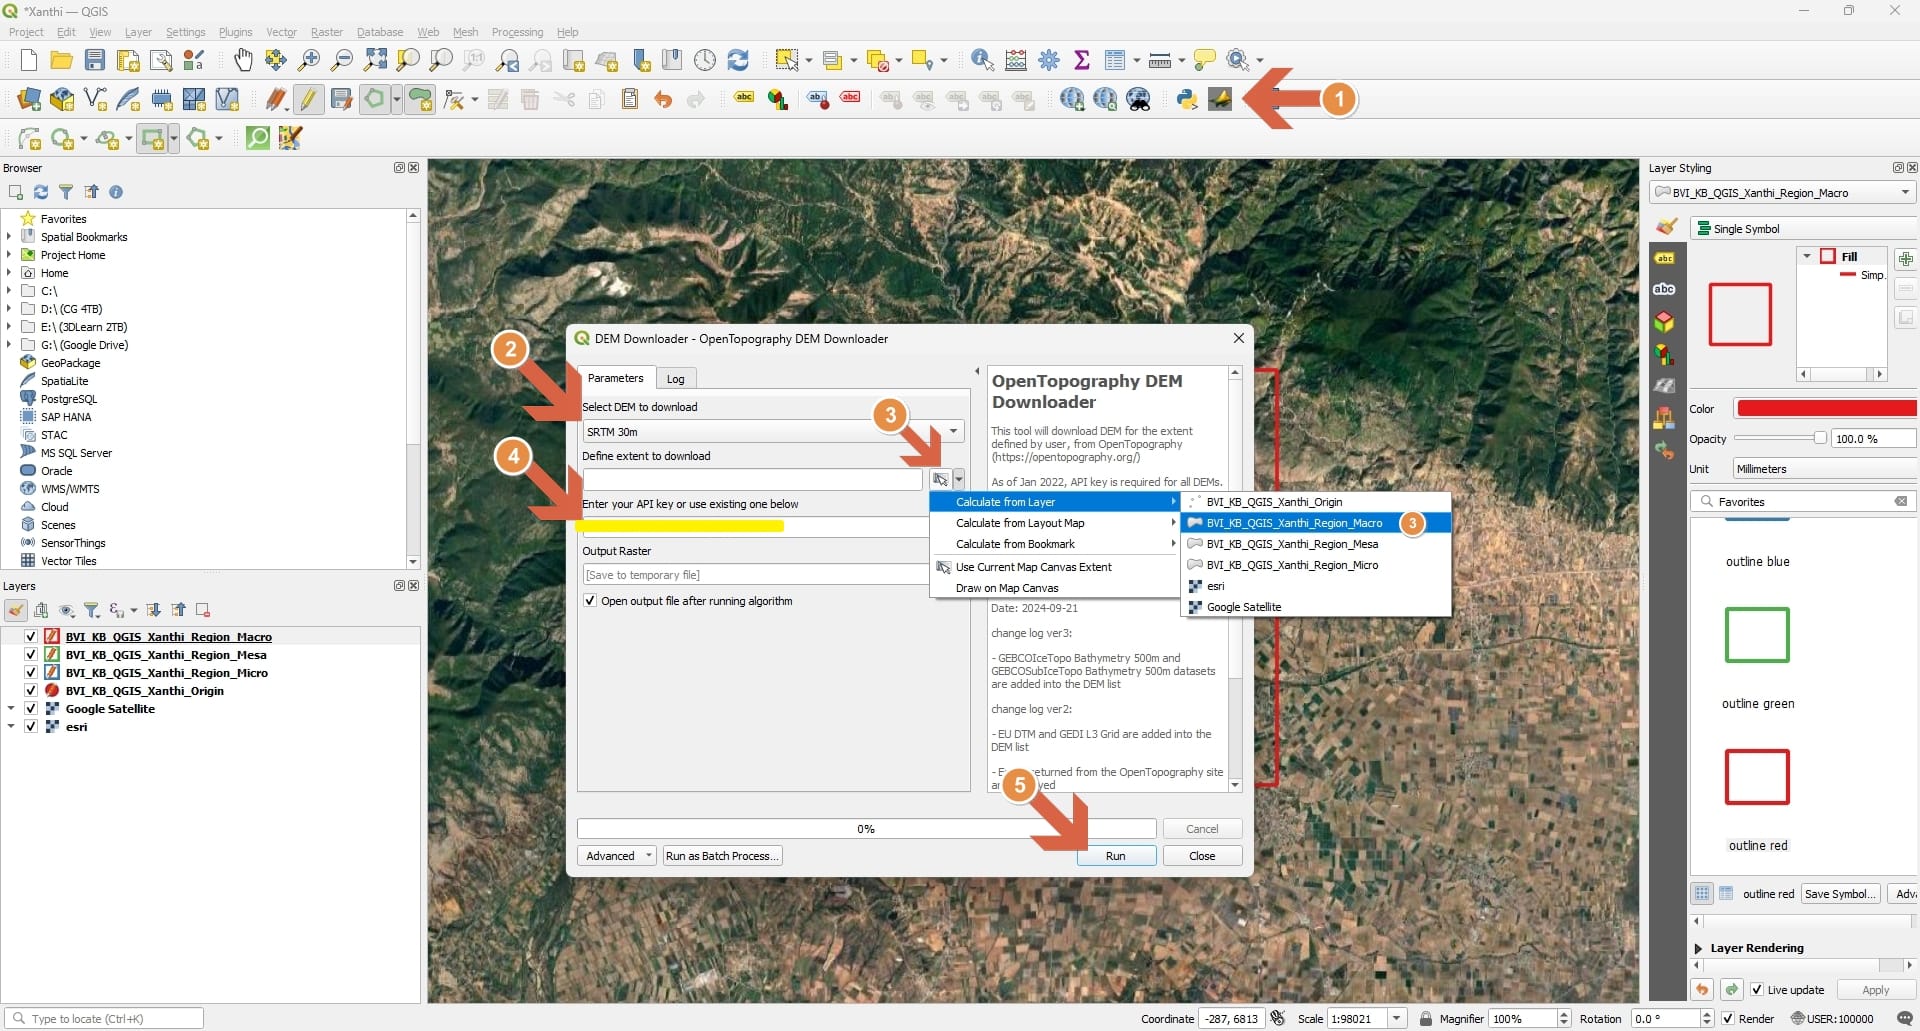
Plugin: OpenTopography DEM Downloader
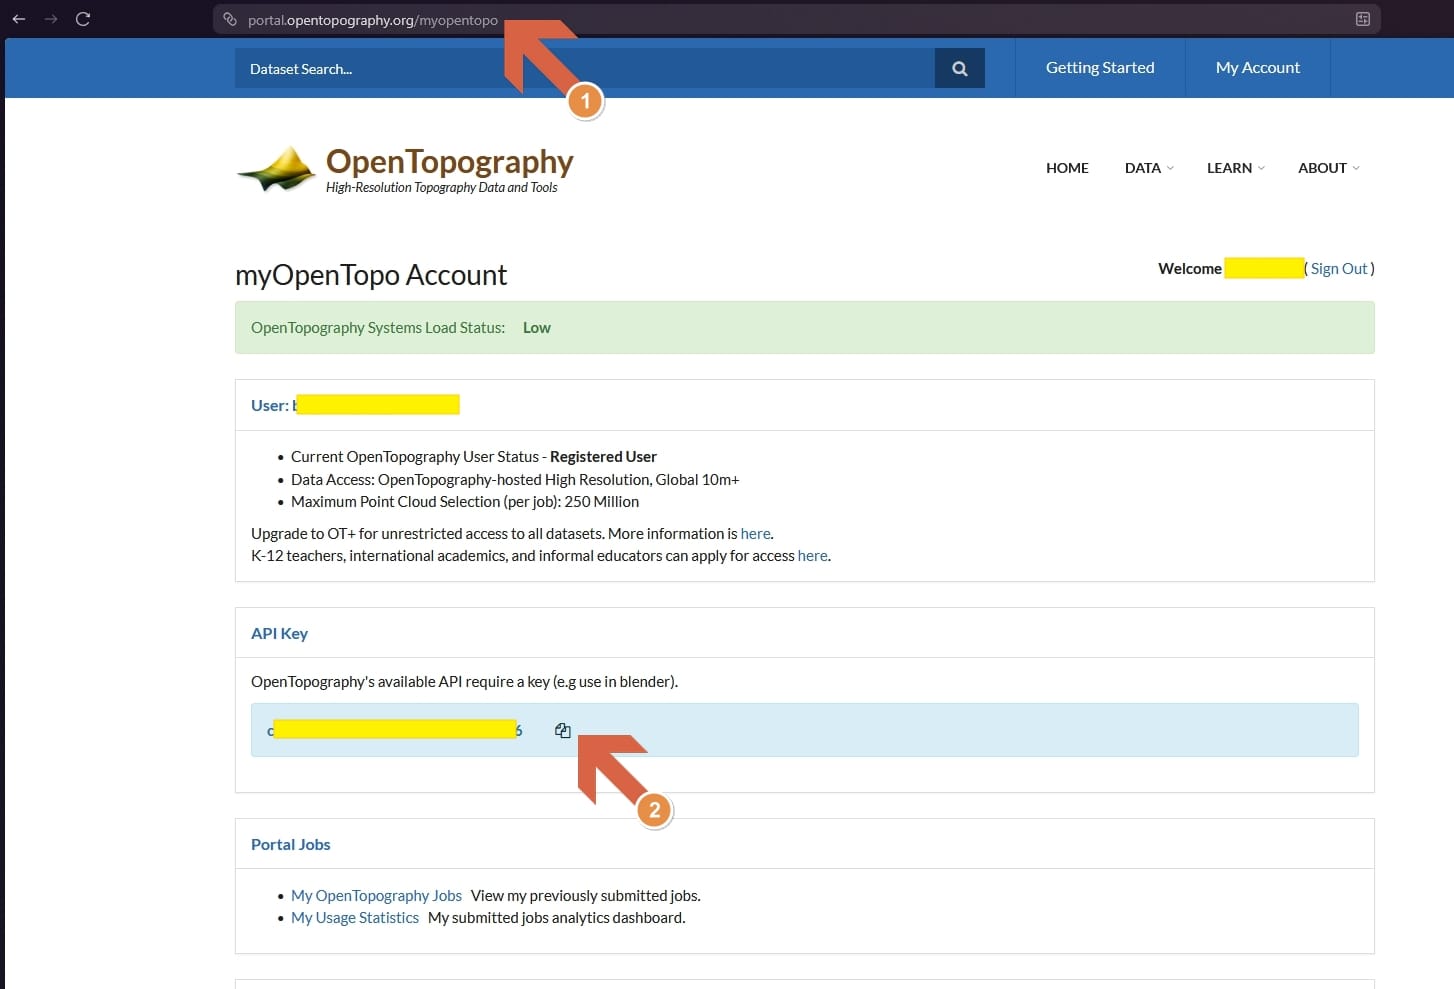
API Key: for this plugin to work you have to create a free API key at https://opentopography.org. A description of how to do this is available here.
This will allow us to get the following DEMS:
- SRTM 90m
- SRTM 30m
- ALOS World 3D 30m
- SRTM GL1 Ellipsoidal 30m
- Global Bathymetry SRTM15+ V2.1
- Copernicus Global DSM 30m
- Copernicus Global DSM 90m
- NASADEM Global DEM
- Europe DTM 30m
- GEDI L3 Grid 1km
- GEBCOIceTopo Bathymetry 500m
- GEBCOSubIceTopo Bathymetry 500m
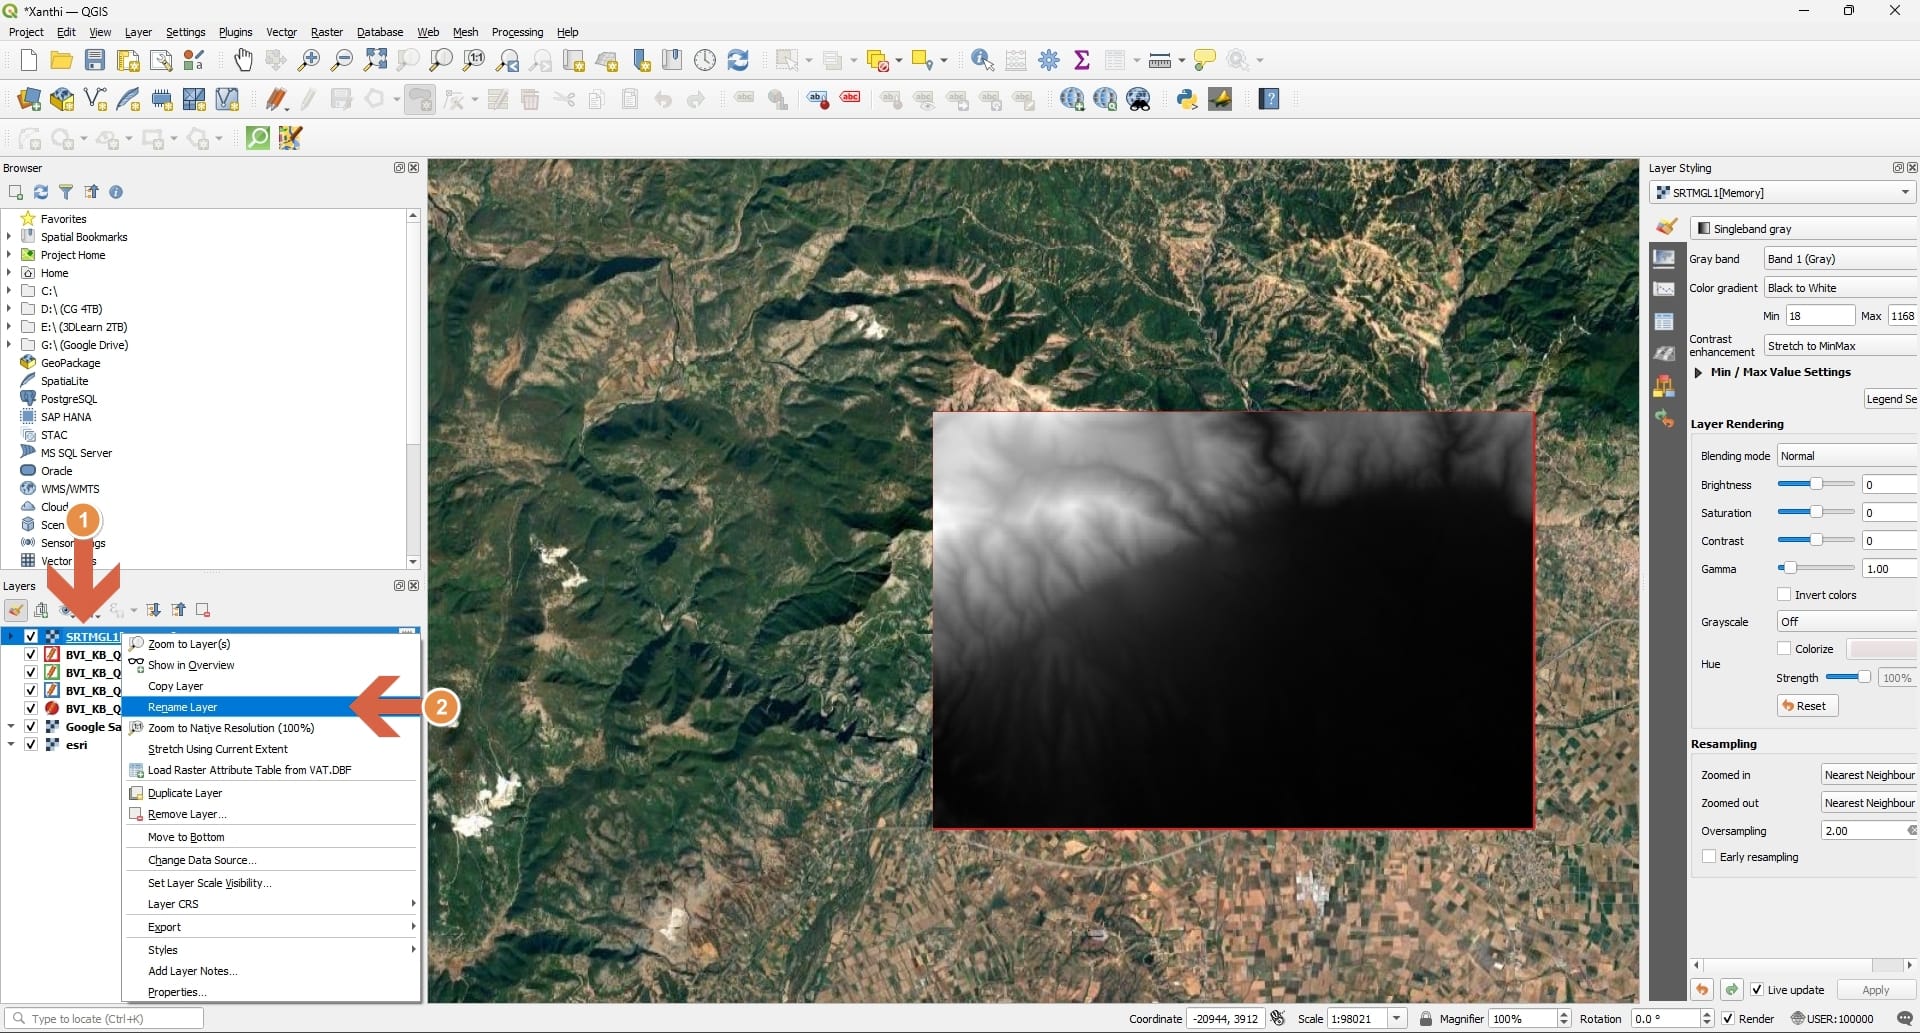
What you're getting: A GeoTIFF file where each pixel value represents elevation in meters above sea level. The file is georeferenced, meaning it knows where on Earth it belongs. Visualizing DEM in QGIS: By default, DEM appears as a grayscale image. To see it better: Right-click layer → Properties → Symbology Change "Render type" to "Singleband pseudocolor" This applies a color gradient to elevation values, making terrain easier to interpret
Understanding the limitations: Remember that 30m resolution means one elevation point per 900 m² (30m × 30m). For a small reconstruction site:
A 50m × 50m area = only about 2-3 elevation points A 200m × 200m area = about 7×7 = 49 elevation points A 2km × 2km area = about 67×67 = 4,500 elevation points
This is why in general it's a good idea to take a broad-to-detailed approach: use DEM for regional terrain context, not for detailed site topography.
OpenStreetMap Data (Roads, Buildings, etc.)
Plugin: QuickOSM
OpenStreetMap is more than just a background map—it's a database of geographic features that you can export and use. Apart from OSM maps we can also import/export shapefiles. OpenStreetMap (OSM) Free, open data created by community contributors Excellent for roads, building footprints, place names Street map style rather than satellite imagery Data can be exported for use (not just viewed) Quality varies by region depending on contributor activity
What OSM provides:
- Building footprints (outlines)
- Roads and pathways
- Land use areas
- Points of interest
- Height information (when available, though often missing)
Accessing OSM data in QGIS:
- Load an OpenStreetMap basemap for visual reference
- To get vector data: Vector → OpenStreetMap → Download Data Or use the QuickOSM plugin for more control
- Select your area and choose feature types (buildings, roads, etc.)
- Data imports as vector layers you can edit and export
Quality note: OSM data quality varies dramatically by region. Well-mapped urban areas might have detailed building footprints with attributes (height, building type, construction date). Remote or unmapped areas might have minimal data. Always visually compare OSM building footprints against satellite imagery to check accuracy.
Export & Import
Export
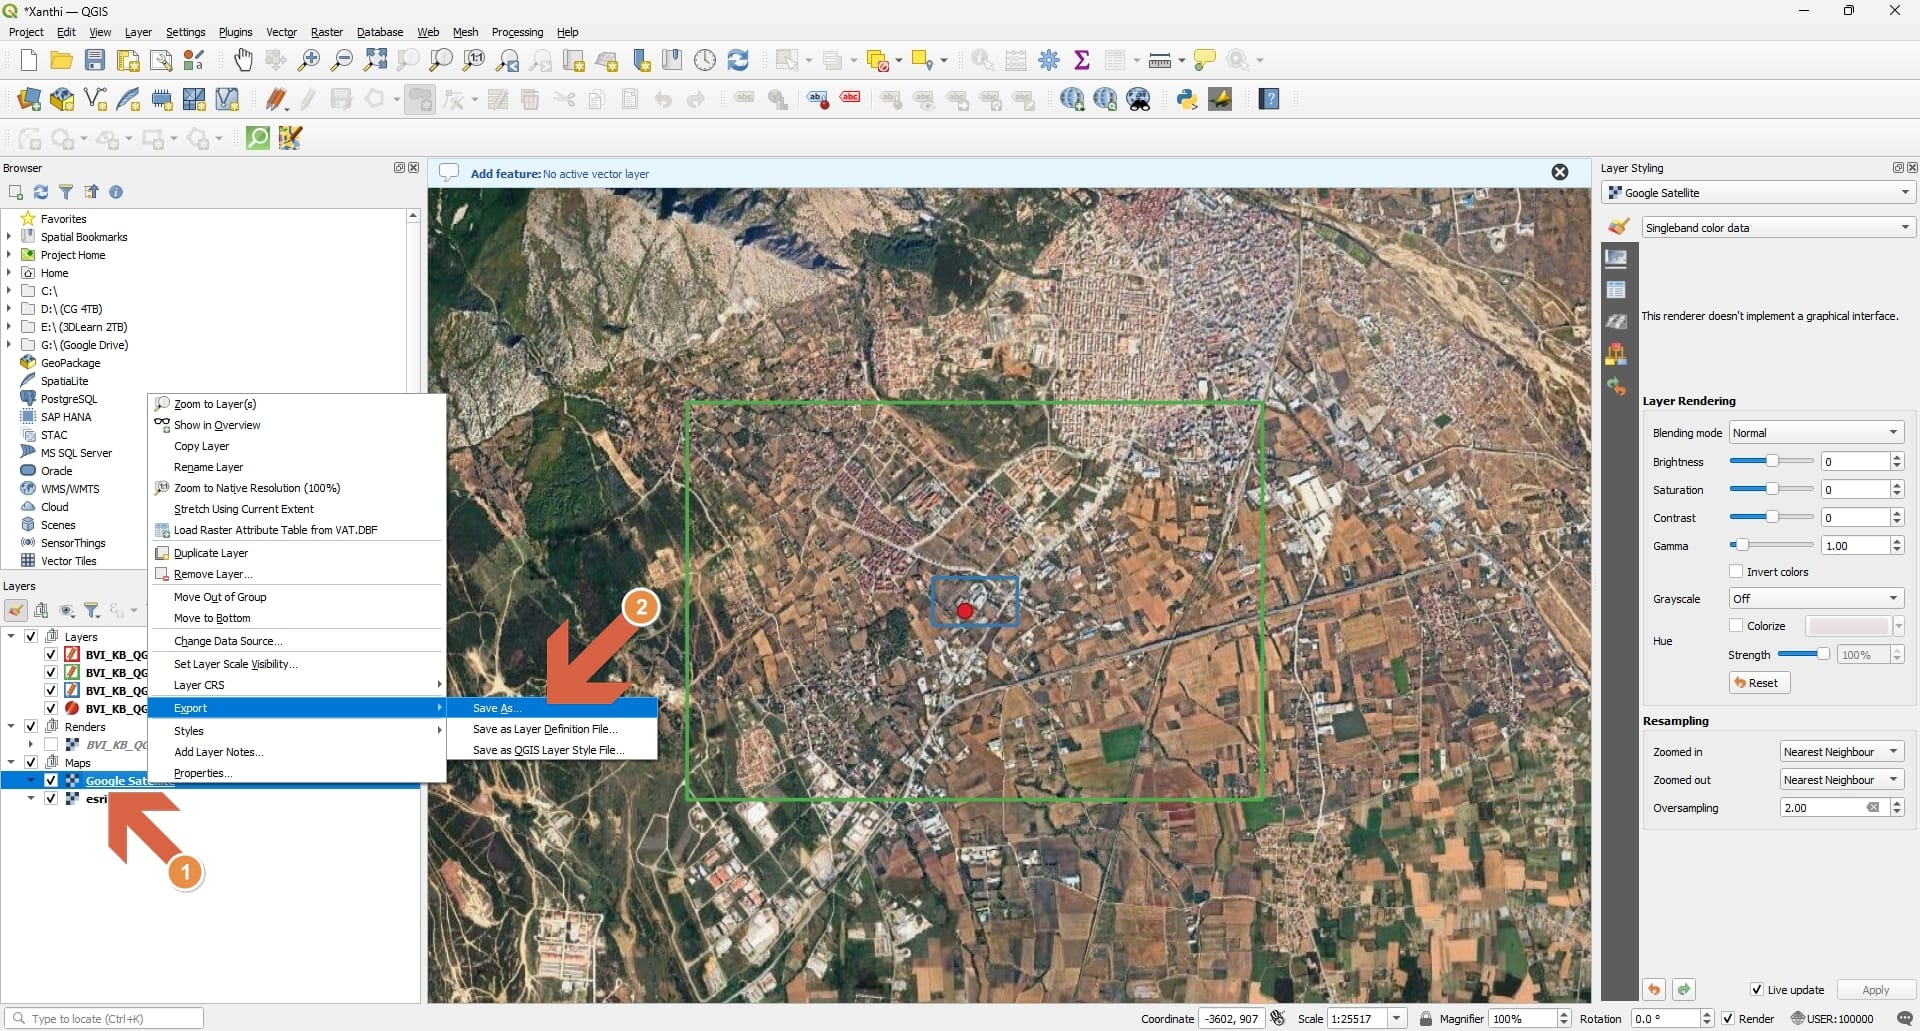
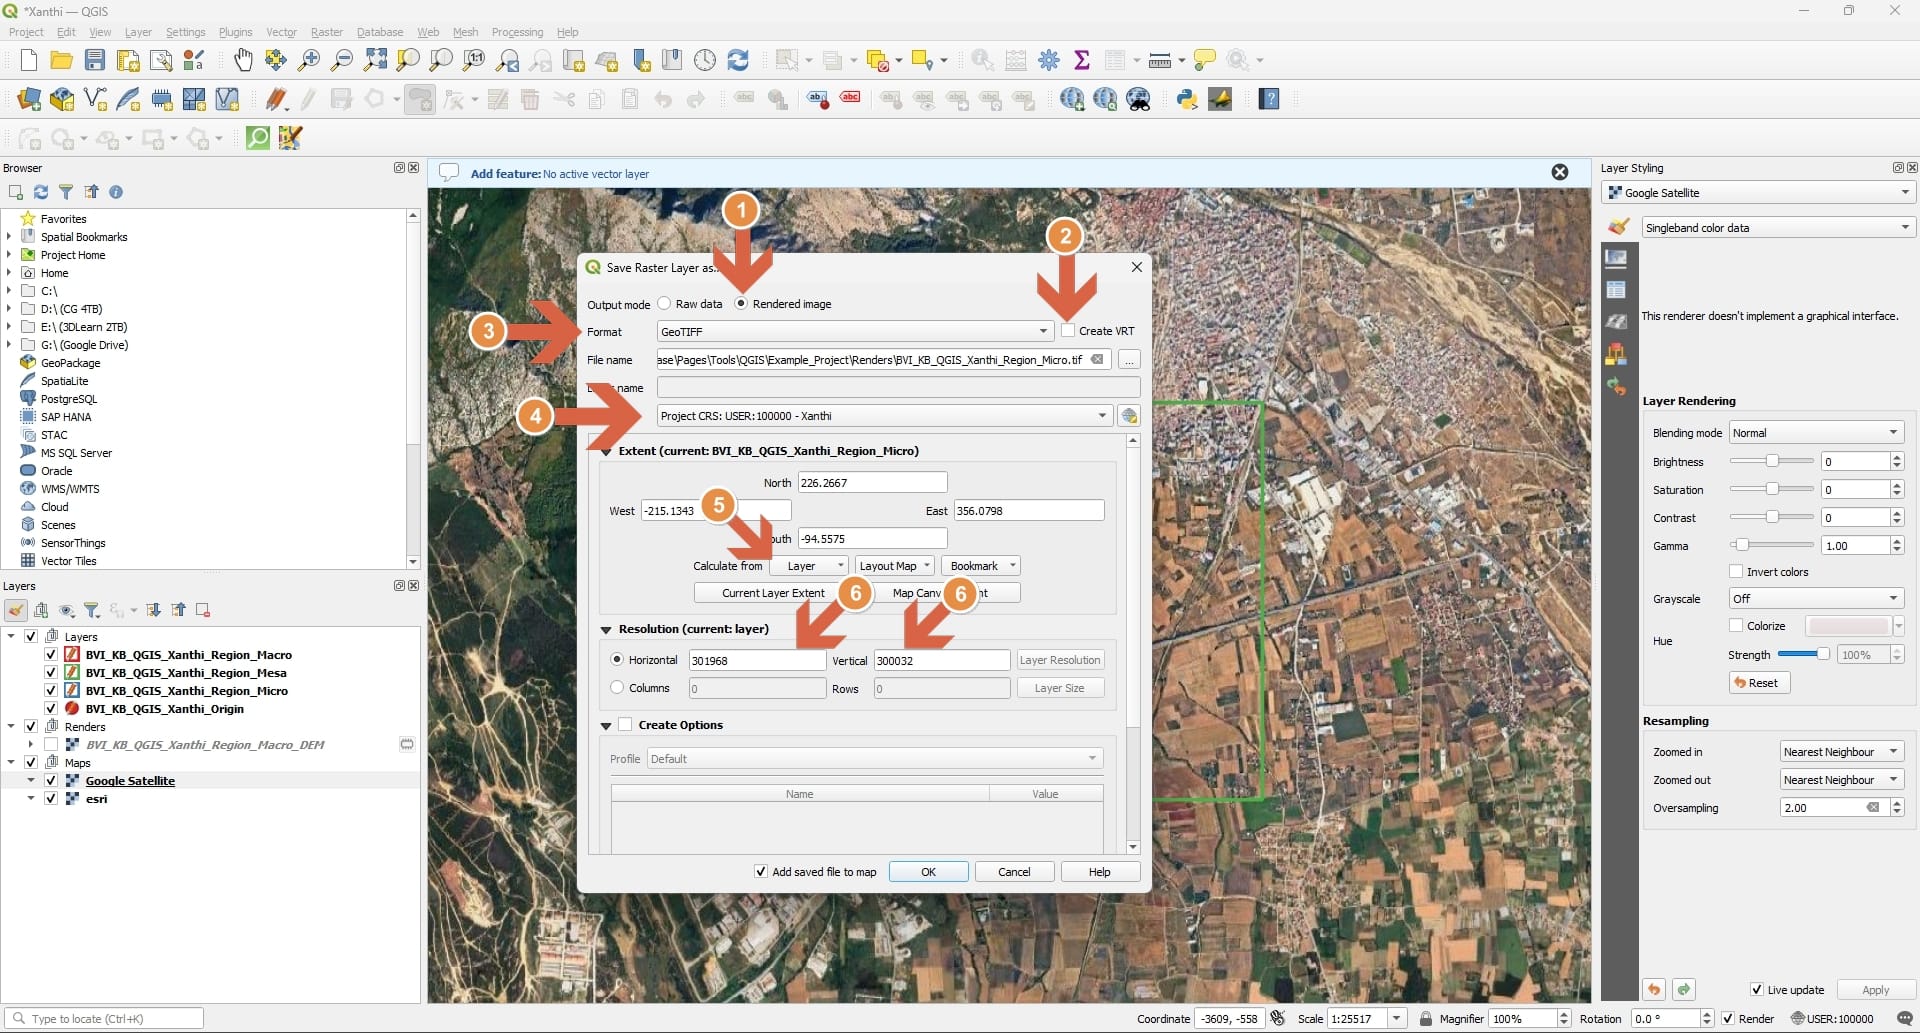
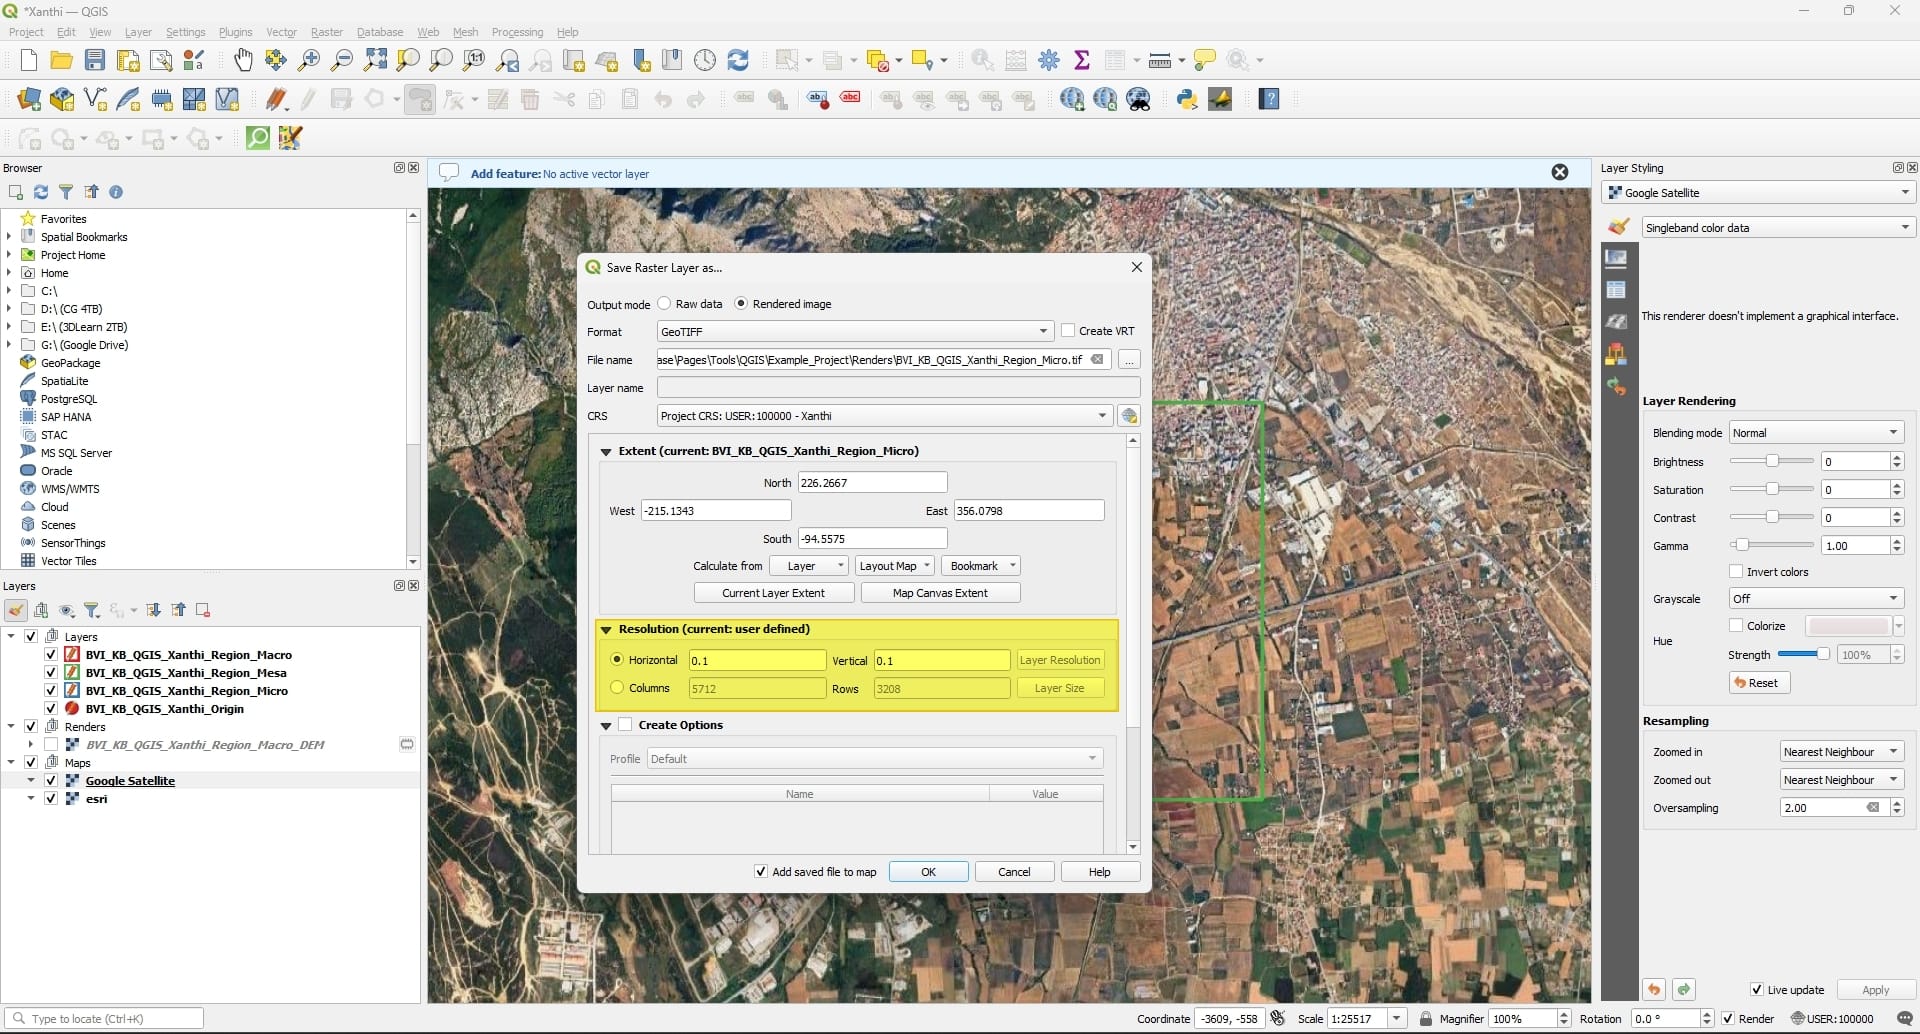
When exporting data from QGIS for use in BlenderGIS, ensure that:
- The CRS of the exported file matches your project's CRS (the custom one you set up earlier).
- DEMs should be exported as RAW GeoTIFF (.tif) files.
- Shapefiles (.shp) are used for vector data like building footprints and roads.
Import in Blender
Base layer
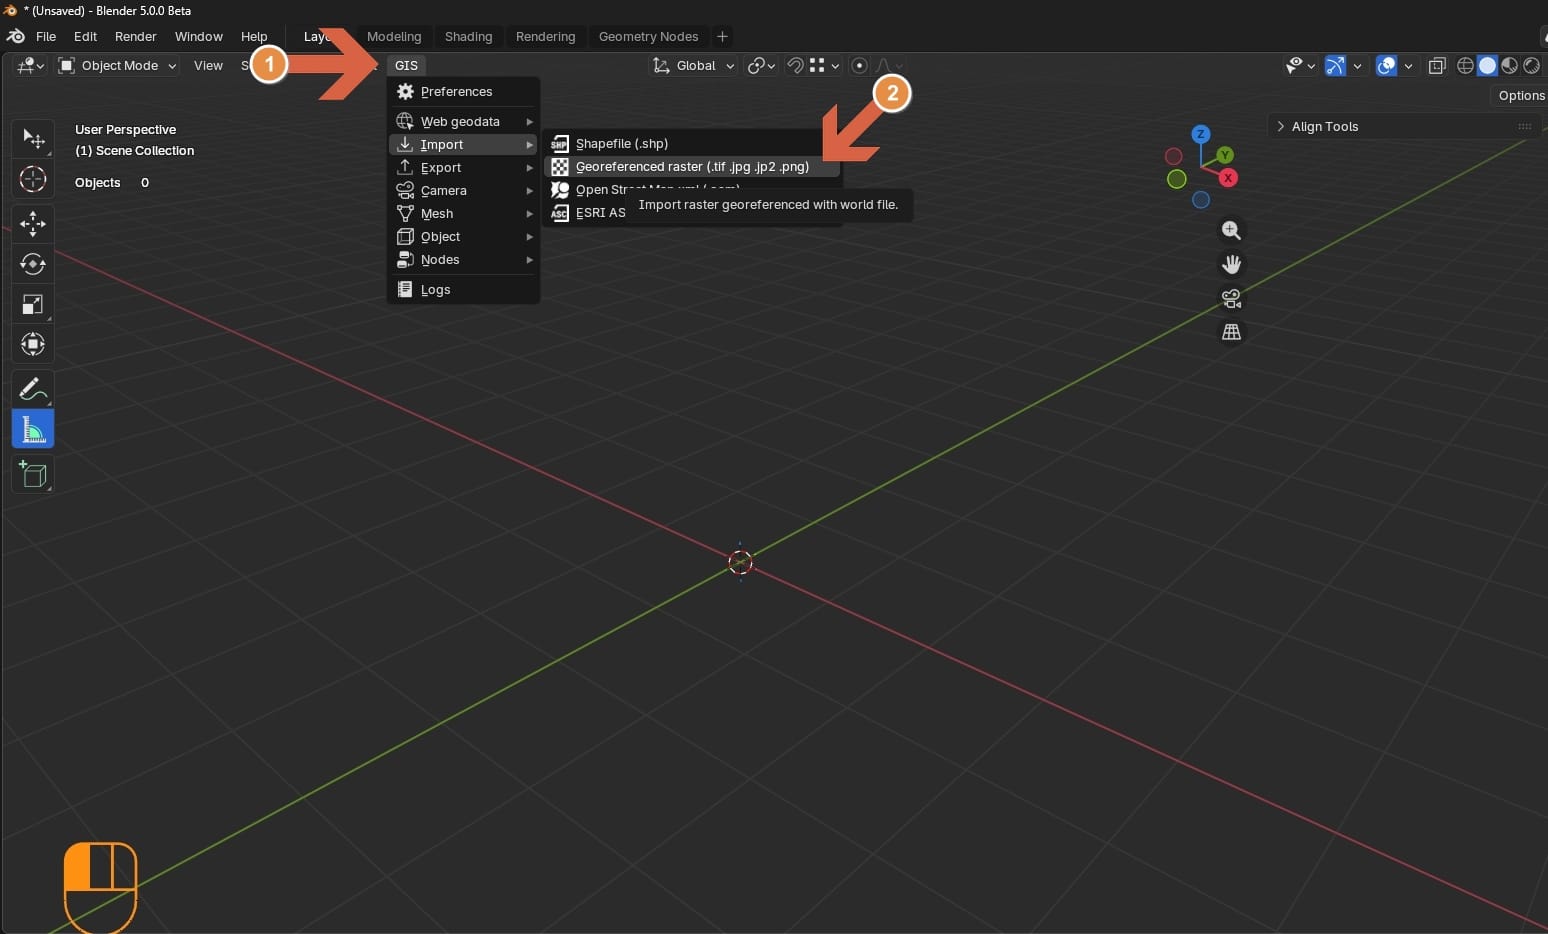
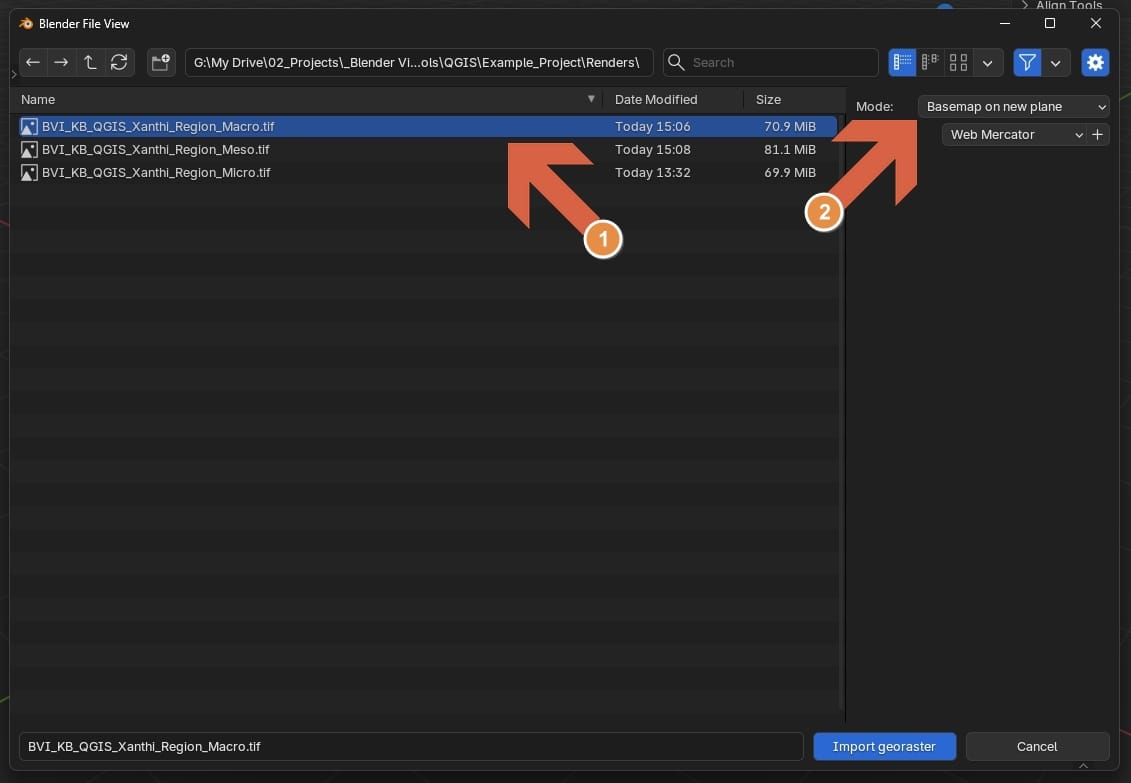
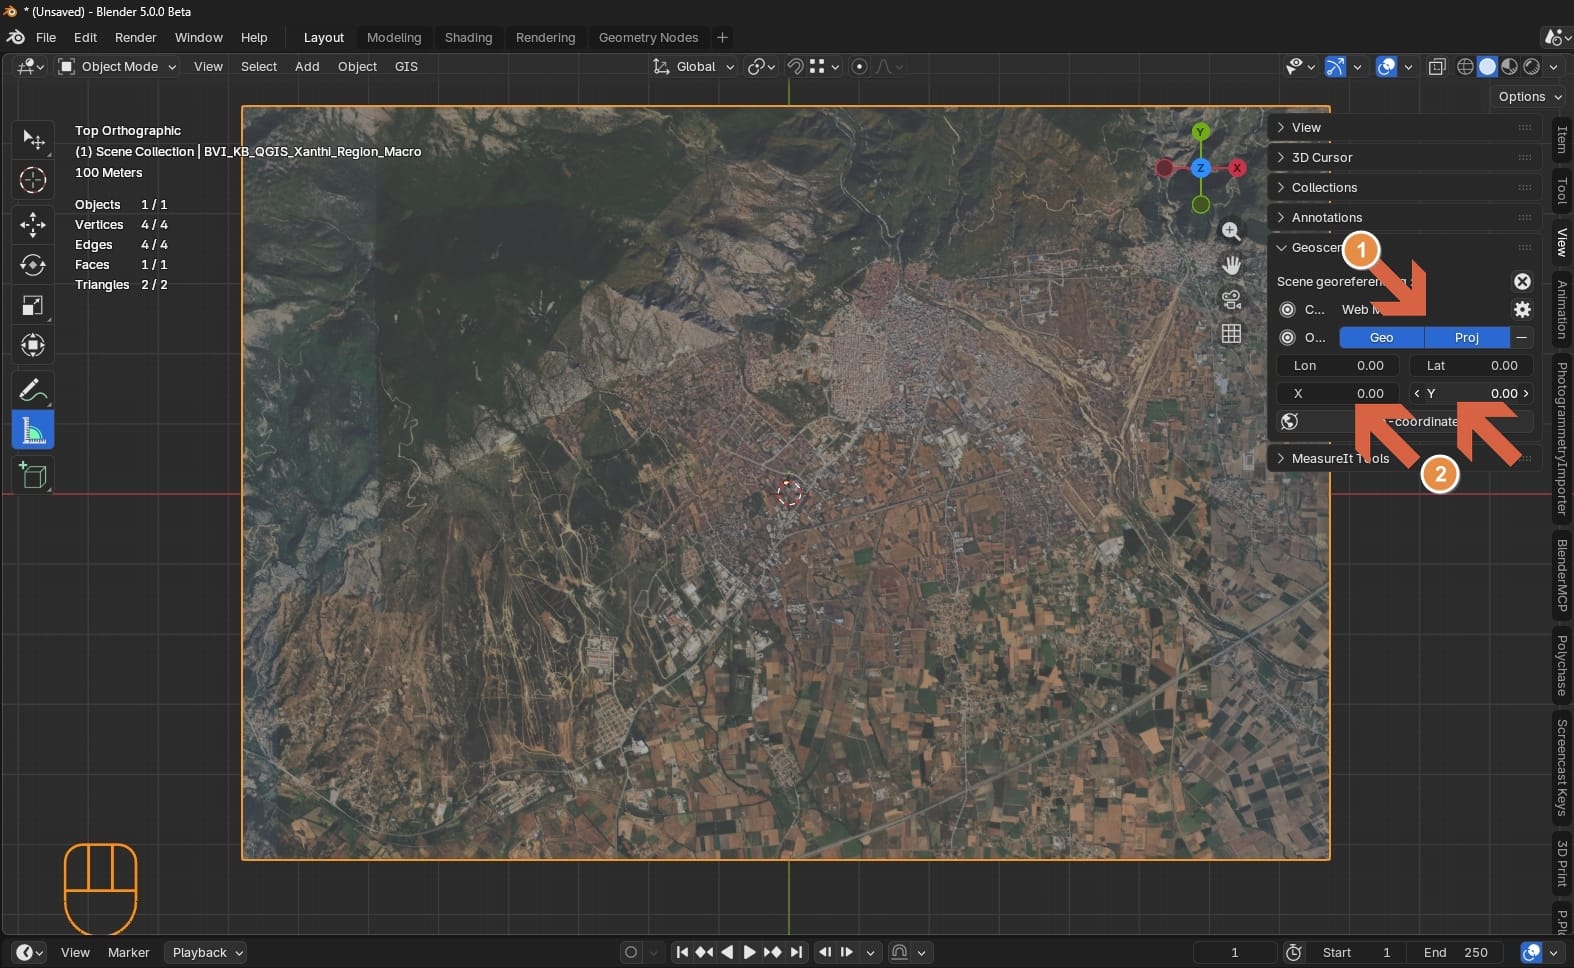
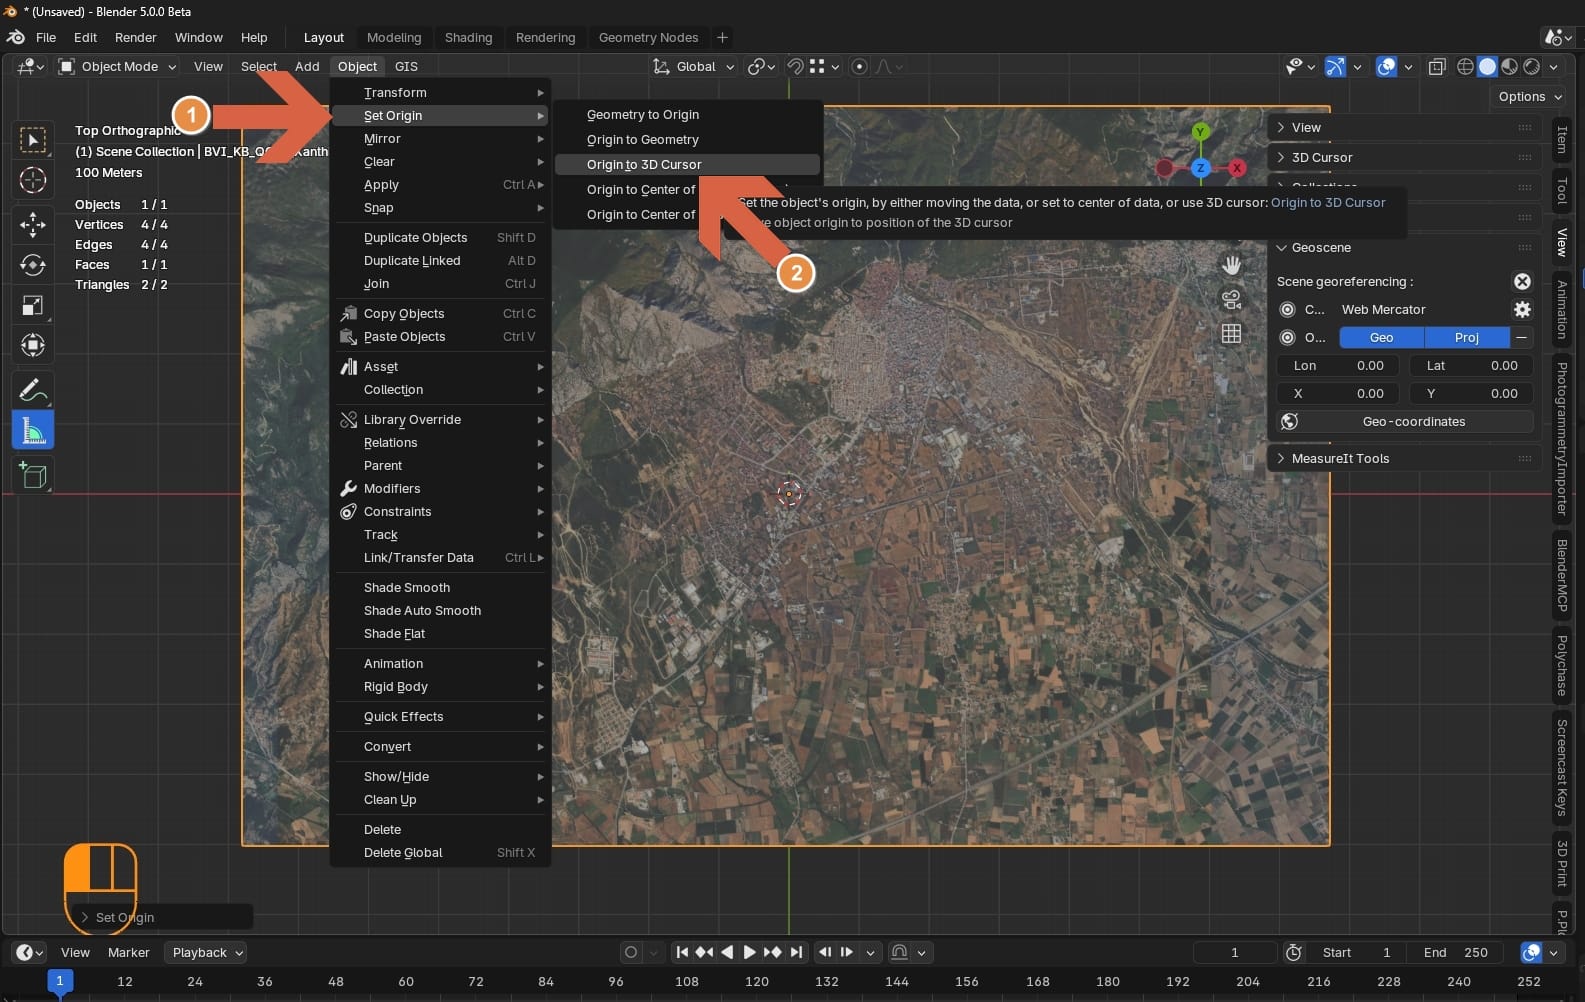
We now have our base image imported and correctly positioned in Blender with scale matching real world scale. Next we will add height to the base and then layer more detailed maps on top.
Add DEM
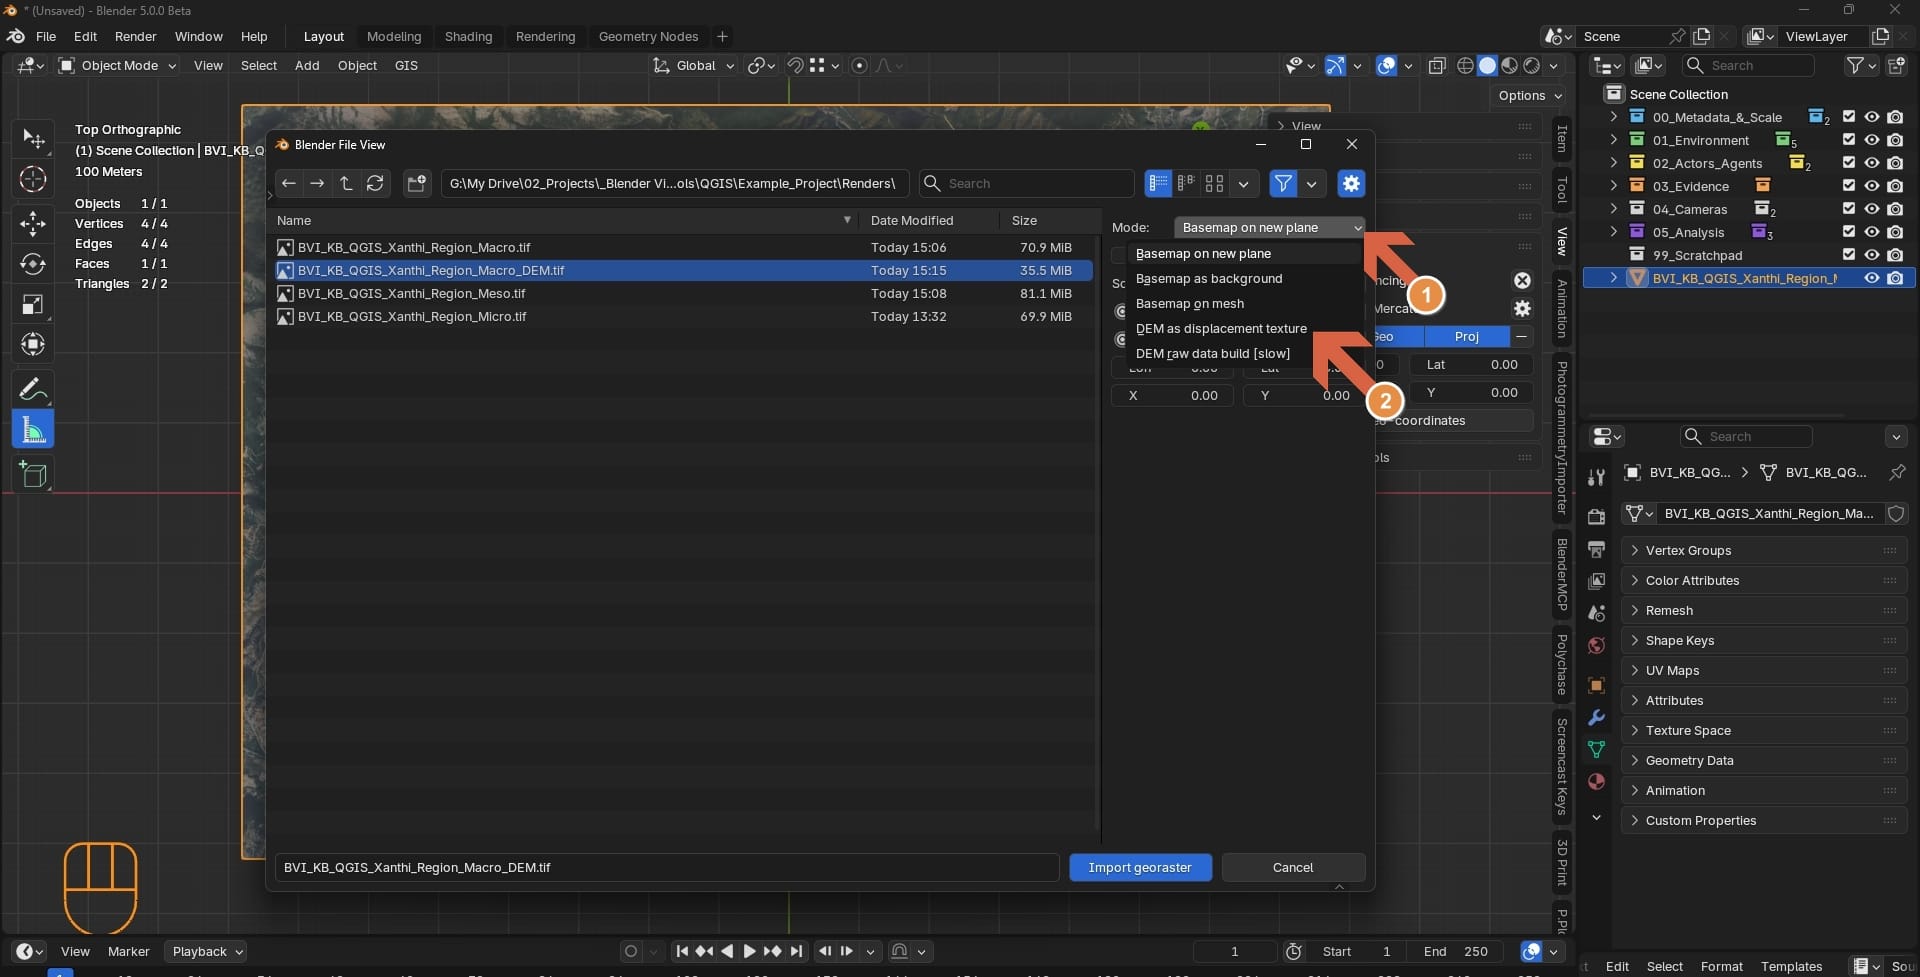
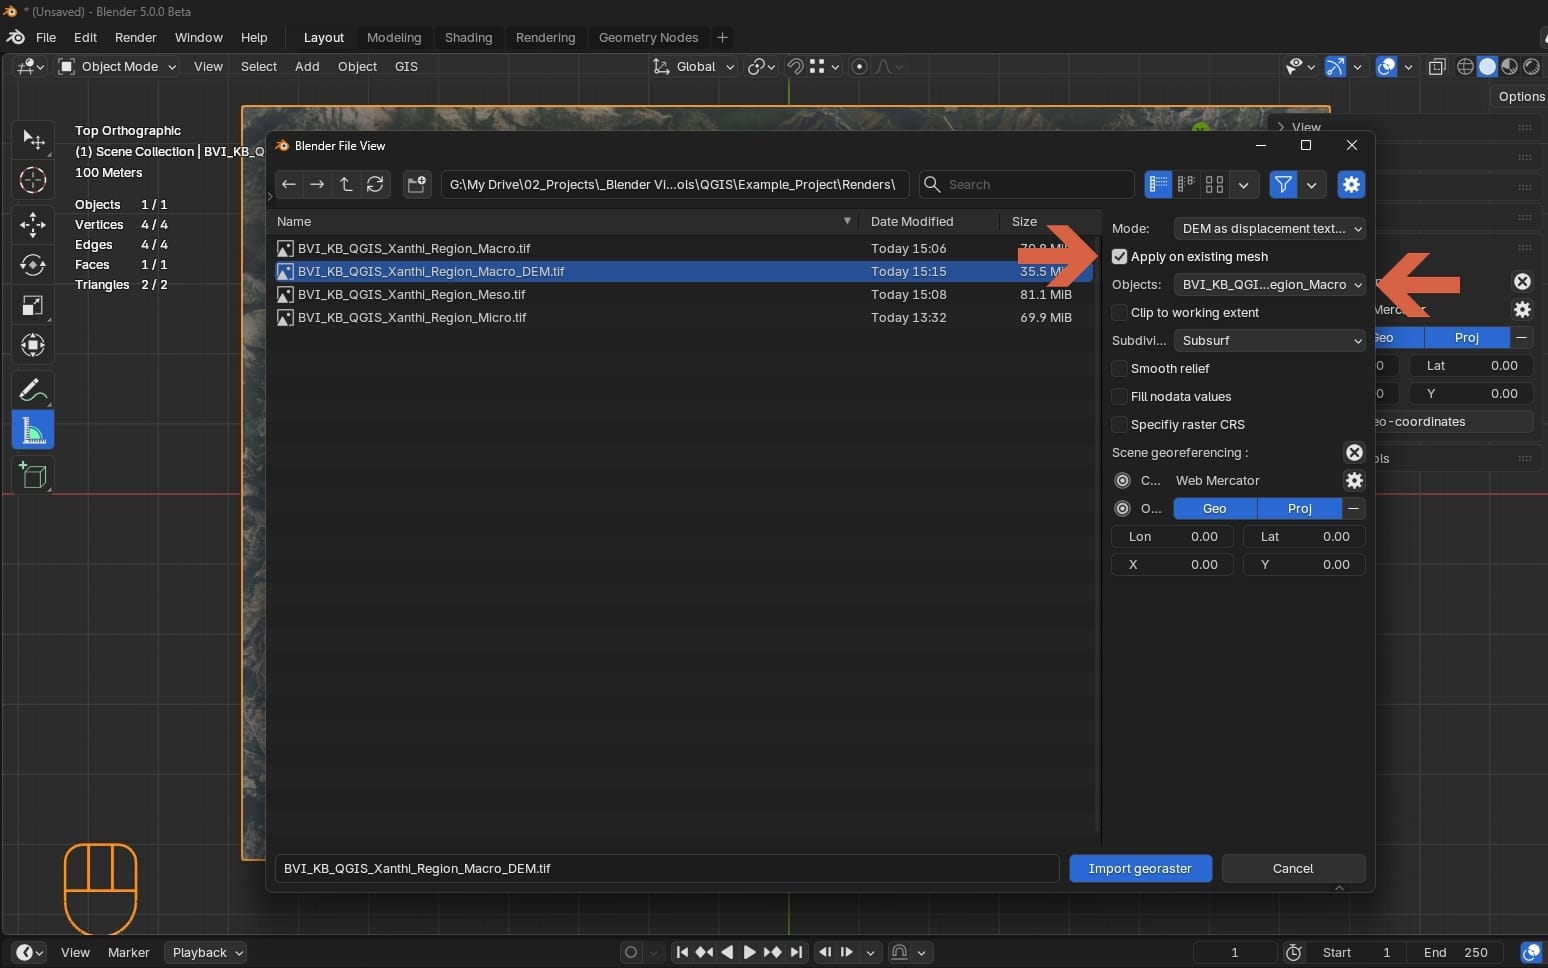
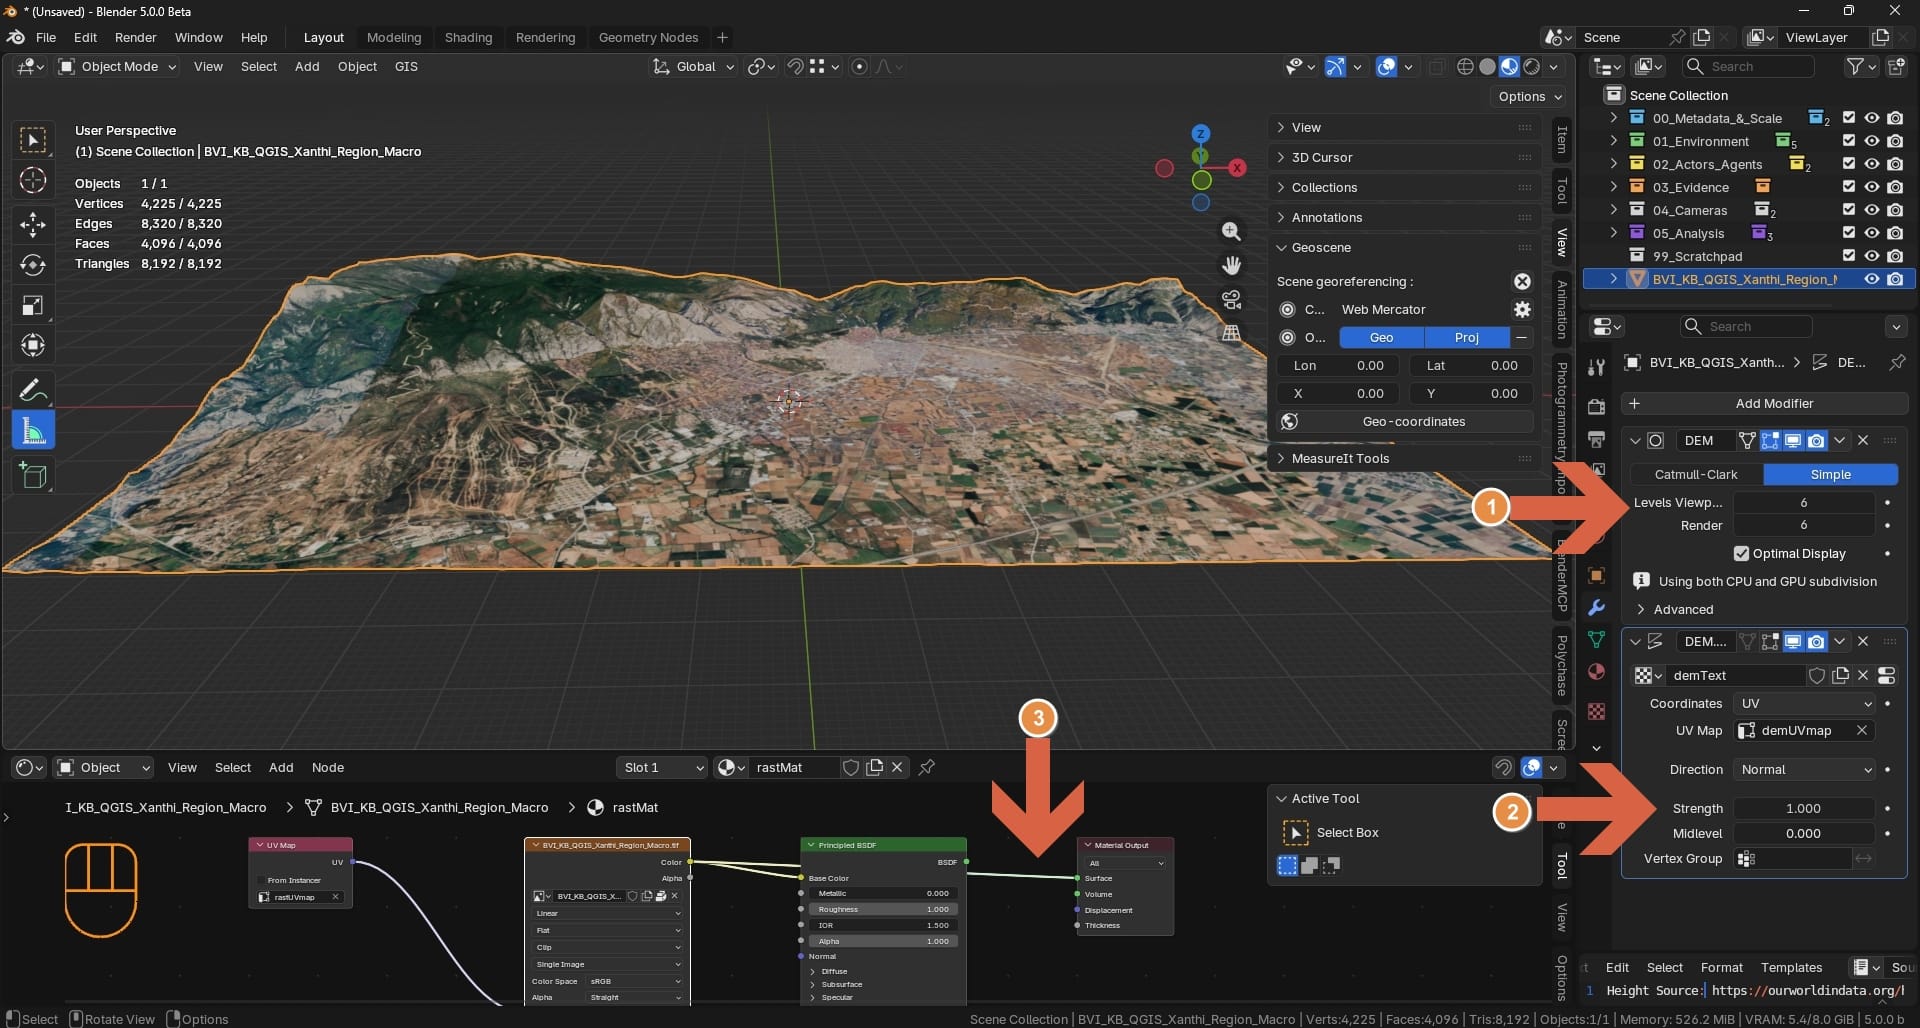
Height is added, and our terrain now has realistic elevation based on the DEM data we exported from QGIS.
Stack layers
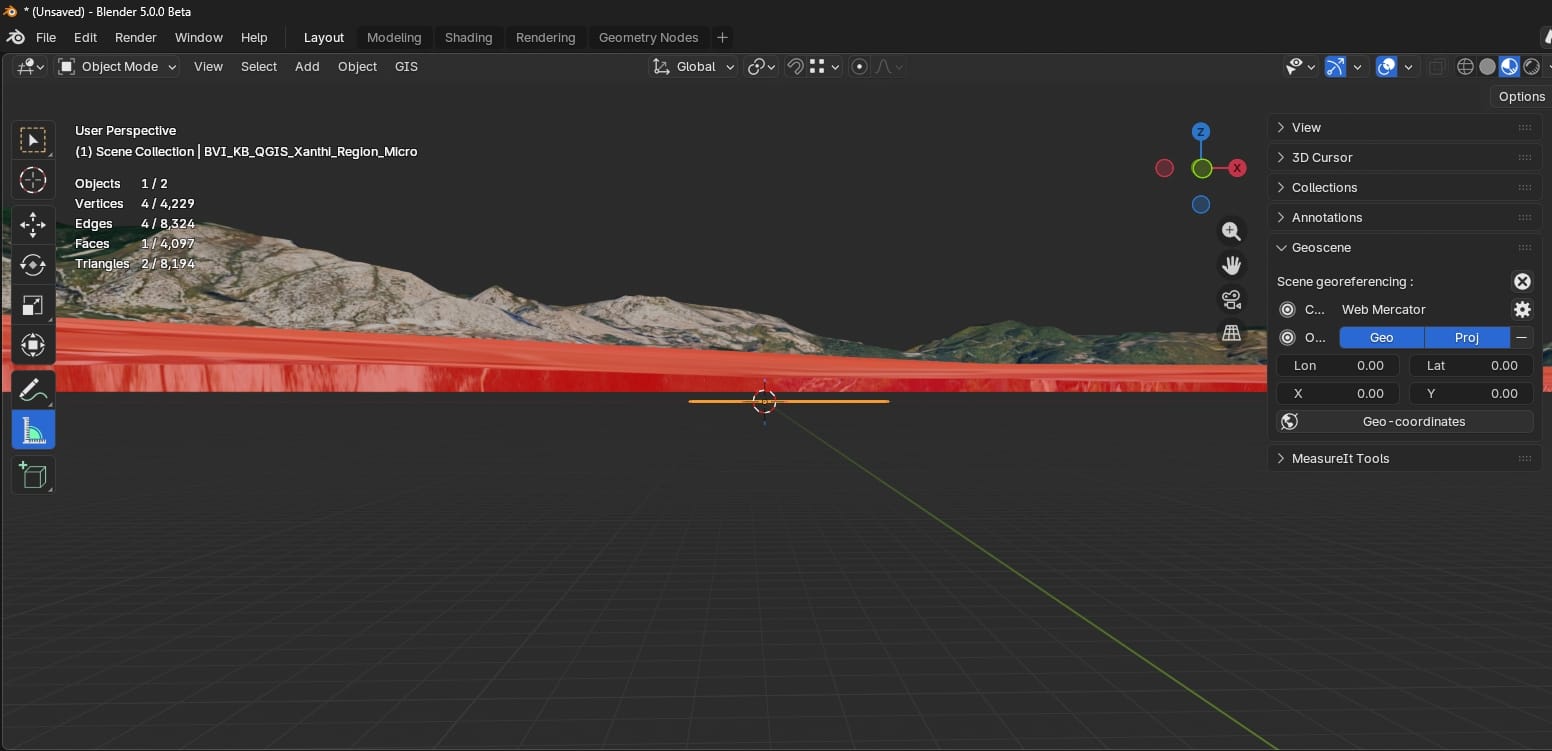
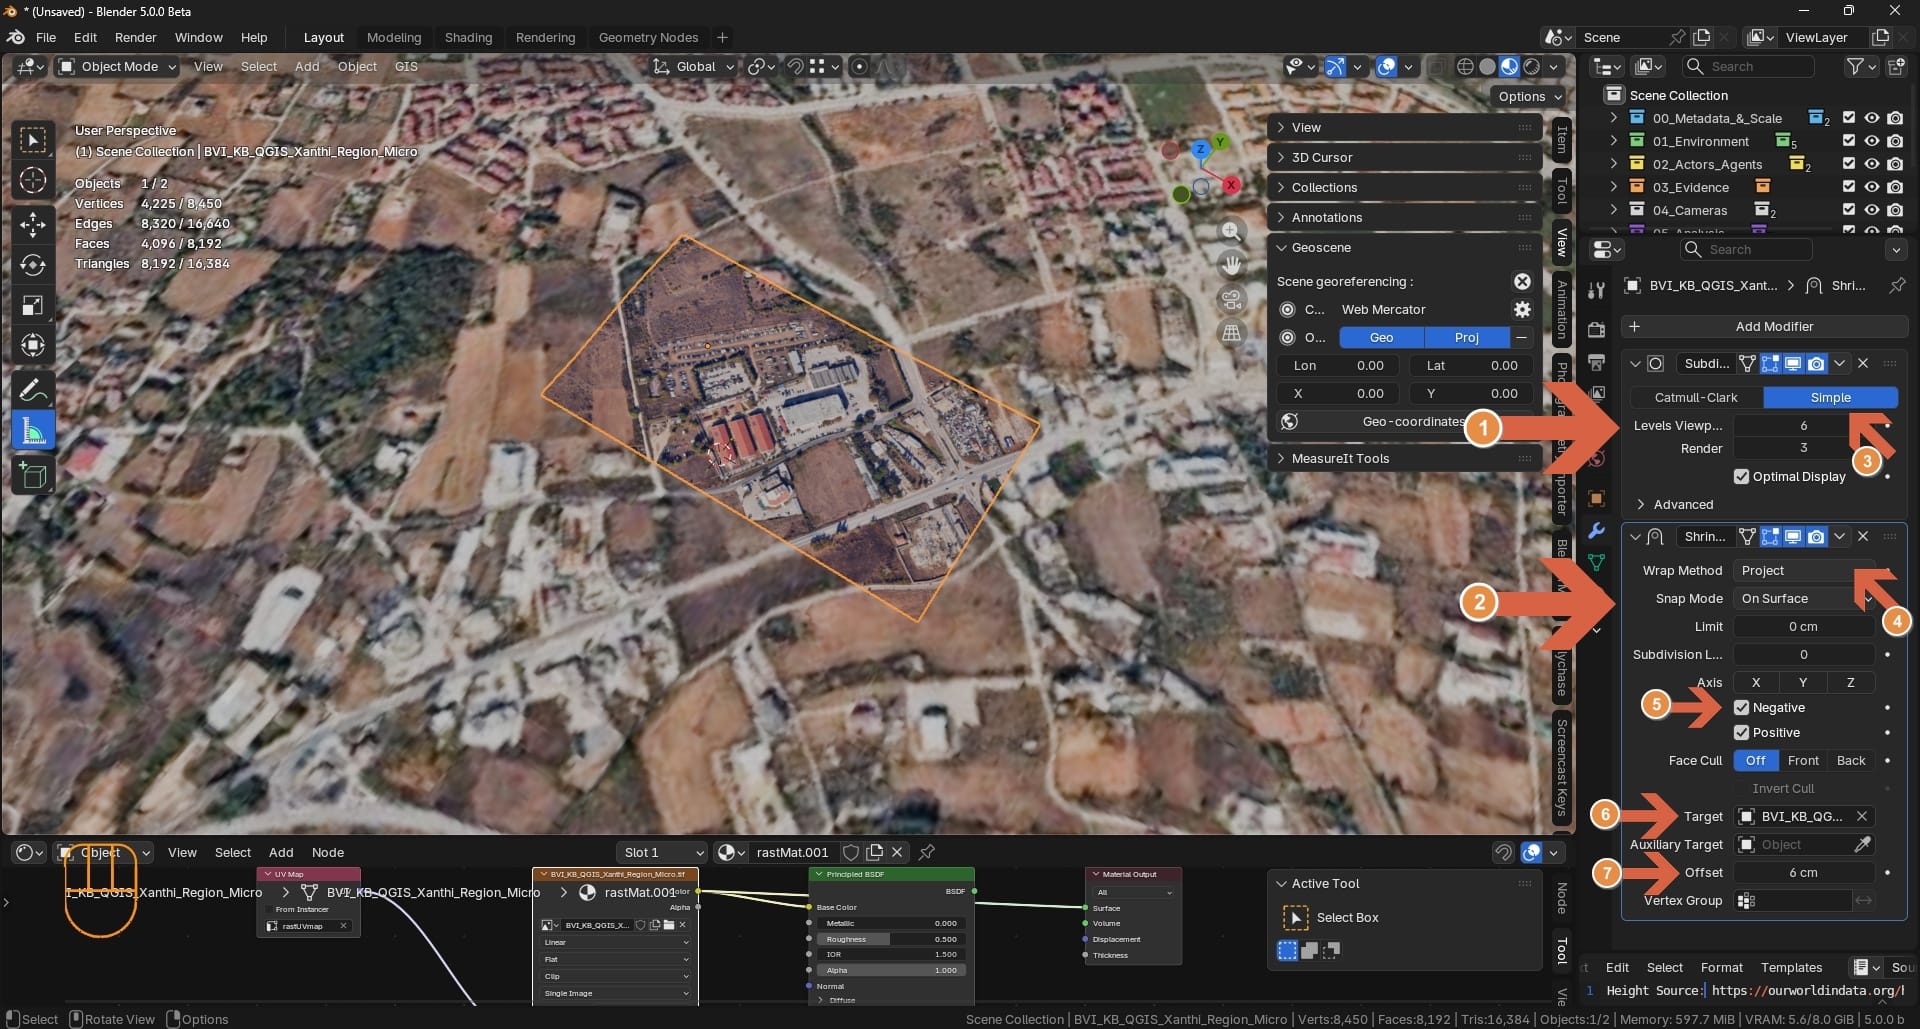
Stacking layers of different maps on top of eachother gives us a rich and detailed 3D reconstruction of our area of interest.
Summary
QGIS is a powerful GIS application that serves as the hub for gathering and preparing geospatial data. By installing key plugins like QuickMapServices and QuickOSM, you can access satellite imagery and vector data directly within QGIS. Setting up a consistent Coordinate Reference System (CRS) ensures that all your data aligns correctly when imported into Blender via the BlenderGIS add-on. Properly acquiring and exporting Digital Elevation Models (DEMs) and other geospatial data from QGIS allows for accurate and context-rich 3D reconstructions in Blender.