QGIS Data Acquisition & Export
Introduction
The baseline setup establishes the base map. This page adds the data that goes on top of it: basemaps for reference, elevation (DEM) for terrain, and OpenStreetMap for vector features. It then covers how to export each layer from QGIS and import it into Blender.
Usage
Add a basemap· QuickMapServices
Basemaps are background map layers from a wide range of online services, and a primary source for satellite imagery and street maps. Install QuickMapServices, then go to Web → QuickMapServices → Settings, open the More services tab, and click Get contributed pack. After that you can add basemaps via Web → QuickMapServices → [Provider] → [Map Type].
Key providers:
- Google Satellite/Hybrid (high-resolution satellite imagery; "Hybrid" includes road labels overlaid on satellite imagery). Best coverage in urban and developed areas. Cannot be directly exported (terms of service), but can be captured for reference.
- Bing Aerial (Microsoft's satellite imagery). Sometimes has better or more recent coverage than Google in certain regions. Different capture dates than Google, so compare them.
- Esri World Imagery. Composite from multiple sources, good global coverage, often used as a baseline.
Comparing sources: Load multiple basemap providers in QGIS as different layers and toggle visibility to compare. You might find Google has better resolution in one area, while Bing has more recent imagery in another. Different capture dates also mean different seasons, lighting, and site conditions.
Download a DEM· OpenTopography
Elevation data (DEM) gives your reconstruction terrain context. Use the OpenTopography plugin with a free API key from opentopography.org (how to get one: API keys guide).
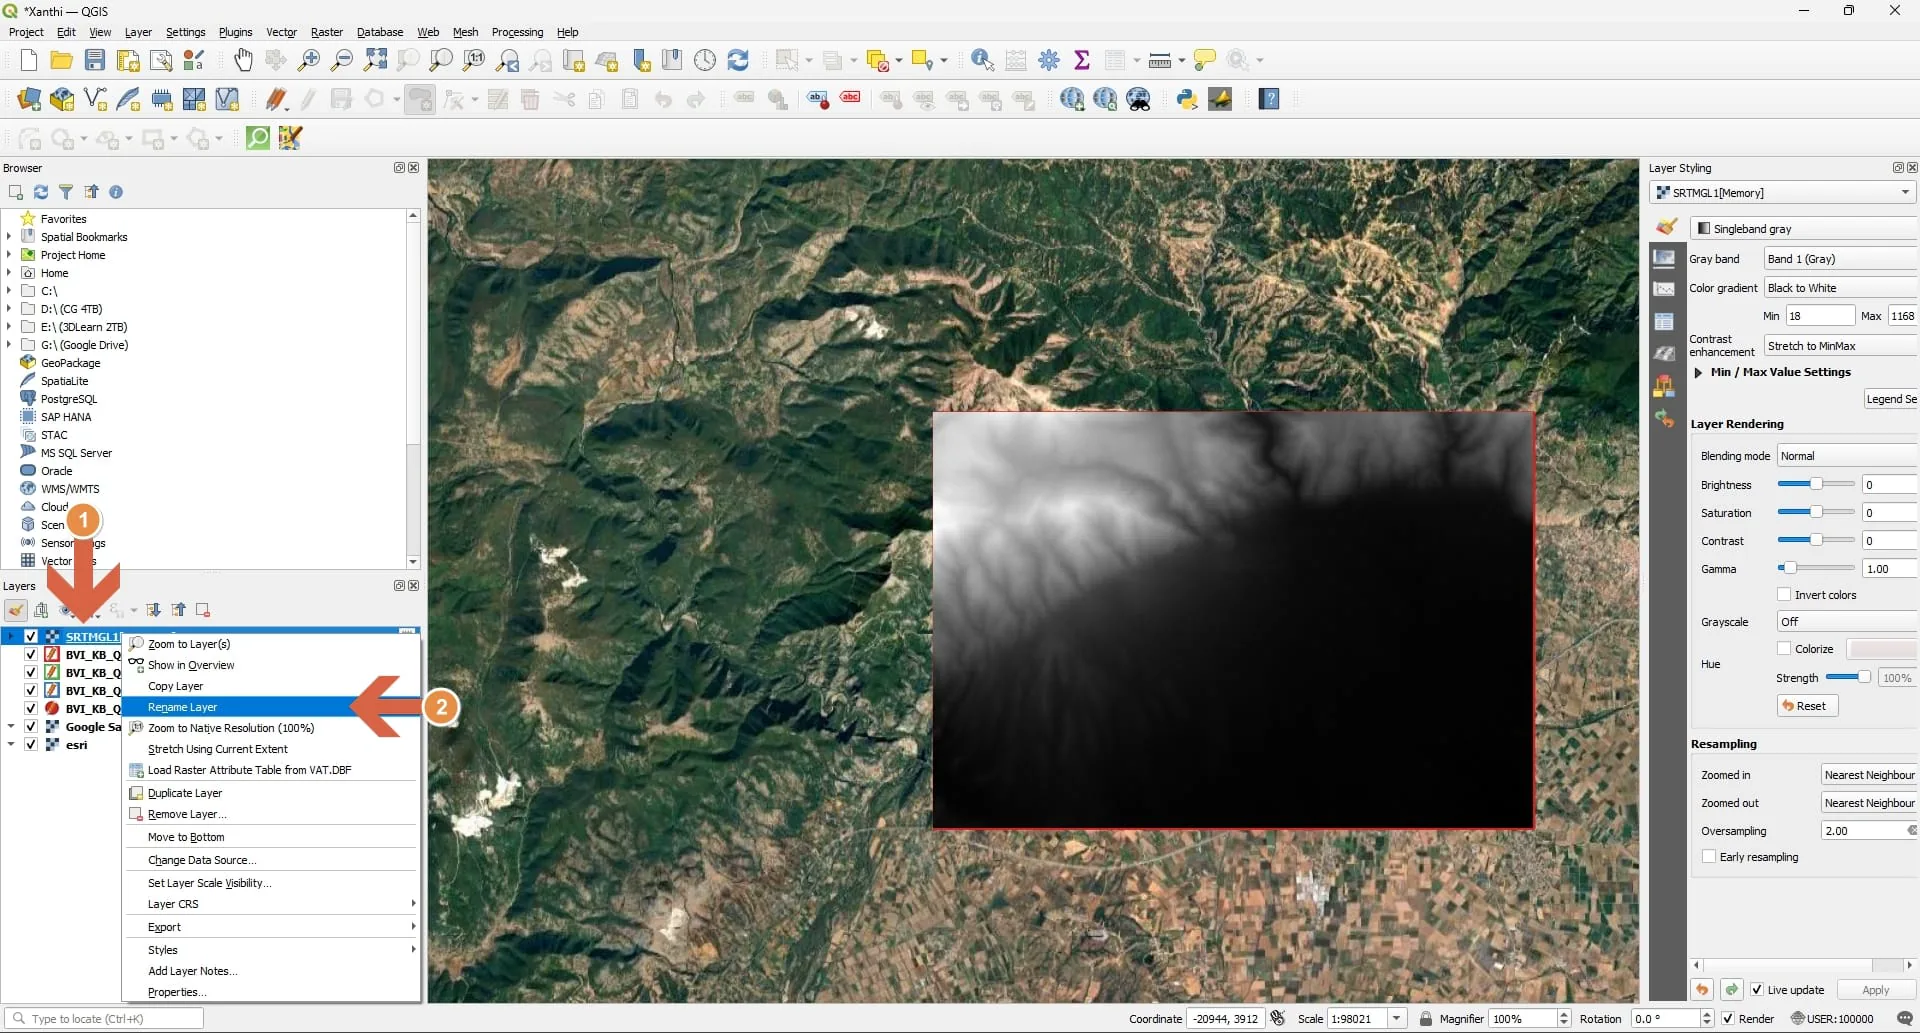 Optionally rename the layer to a more descriptive name for easier identification.
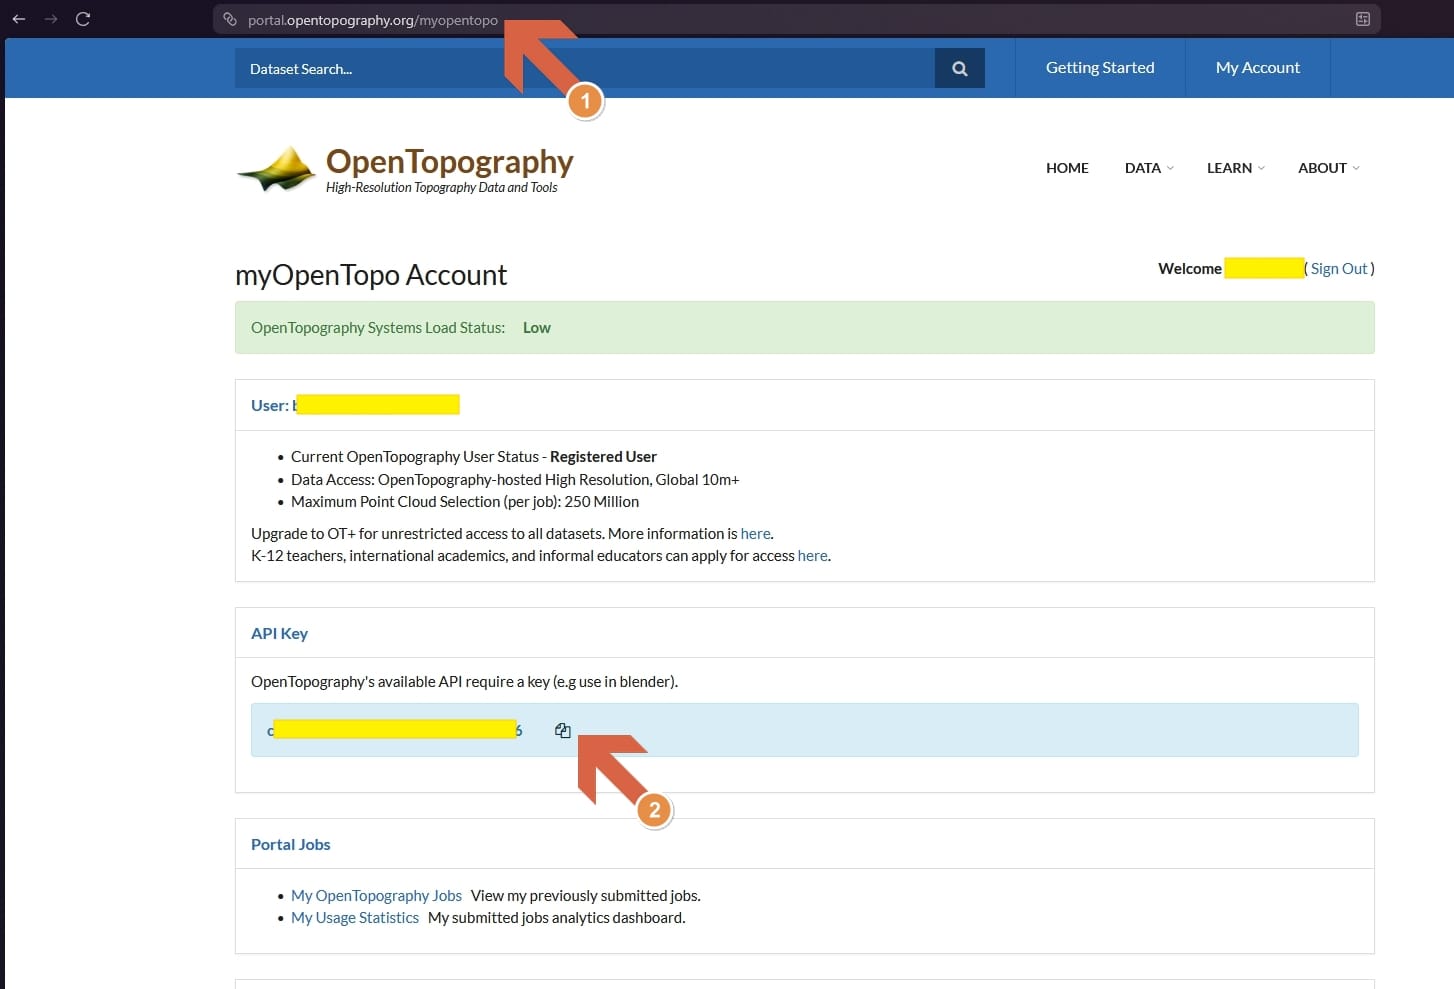 Create a free API key at https://opentopography.org. A description of how to do this is available [here](https://opentopography.org/blog/introducing-api-keys-access-opentopography-global-datasets).
 After installing the OpenTopography plugin, select it from the toolbar section (1), pick your source (2) (SRTM 30 gives good results), select the appropriate area (3), fill in your API key (4) and download the DEM (5).Optionally rename the layer to a more descriptive name for easier identification.Create a free API key at https://opentopography.org. A description of how to do this is available [here](https://opentopography.org/blog/introducing-api-keys-access-opentopography-global-datasets).
The plugin can download these DEMs: SRTM 90m, SRTM 30m (a good default), ALOS World 3D 30m, SRTM GL1 Ellipsoidal 30m, Global Bathymetry SRTM15+ V2.1, Copernicus Global DSM 30m, Copernicus Global DSM 90m, NASADEM Global DEM, Europe DTM 30m, GEDI L3 Grid 1km, GEBCOIceTopo Bathymetry 500m, and GEBCOSubIceTopo Bathymetry 500m.
What you get: A GeoTIFF file where each pixel value represents elevation in meters above sea level. The file is georeferenced, meaning it knows where on Earth it belongs.
Visualizing the DEM in QGIS: By default a DEM appears as a grayscale image. To see it better: right-click the layer → Properties → Symbology, and change "Render type" to "Singleband pseudocolor". This applies a color gradient to elevation values, making terrain easier to interpret.
Understanding the limitations: Remember that 30m resolution means one elevation point per 900 m² (30m × 30m). For a small reconstruction site:
- A 50m × 50m area = only about 2–3 elevation points
- A 200m × 200m area = about 7×7 = 49 elevation points
- A 2km × 2km area = about 67×67 = 4,500 elevation points
This is why a broad-to-detailed approach works: use the DEM for regional terrain context, not for detailed site topography.
Download OpenStreetMap data· QuickOSM
OpenStreetMap is more than a background map. It is a database of geographic features that you can export and use. Install the QuickOSM plugin for more control over what you download.
OpenStreetMap (OSM) is free, open data created by community contributors. Good for roads, building footprints, and place names. Street map style rather than satellite imagery. Data can be exported for use. Quality varies by region depending on contributor activity.
What OSM provides: building footprints (outlines), roads and pathways, land use areas, points of interest, and height information (when available, though often missing).
Accessing OSM data in QGIS: load an OpenStreetMap basemap for visual reference. To get vector data, use Vector → OpenStreetMap → Download Data, or use the QuickOSM plugin for more control. Select your area and choose feature types (buildings, roads, etc.). The data imports as vector layers you can edit and export.
Quality note: OSM data quality varies dramatically by region. Well-mapped urban areas might have detailed building footprints with attributes (height, building type, construction date). Remote or unmapped areas might have minimal data. Always visually compare OSM building footprints against satellite imagery to check accuracy.
Export from QGIS
QGIS exports both raster and vector data. Right-click the layer you want to export and choose Export → Save As….
 Export step 3In this case, a value of 0.1 gives me a resolution of 5712x3208, which is a good resolution that will capture the necessary detail without creating an excessively large file. Make sure to adjust the value to your project needs. Optionally we can toggle 'add saved file to map' to include the render in our layer stack. Now we can press OK and let QGIS download the necessary data.
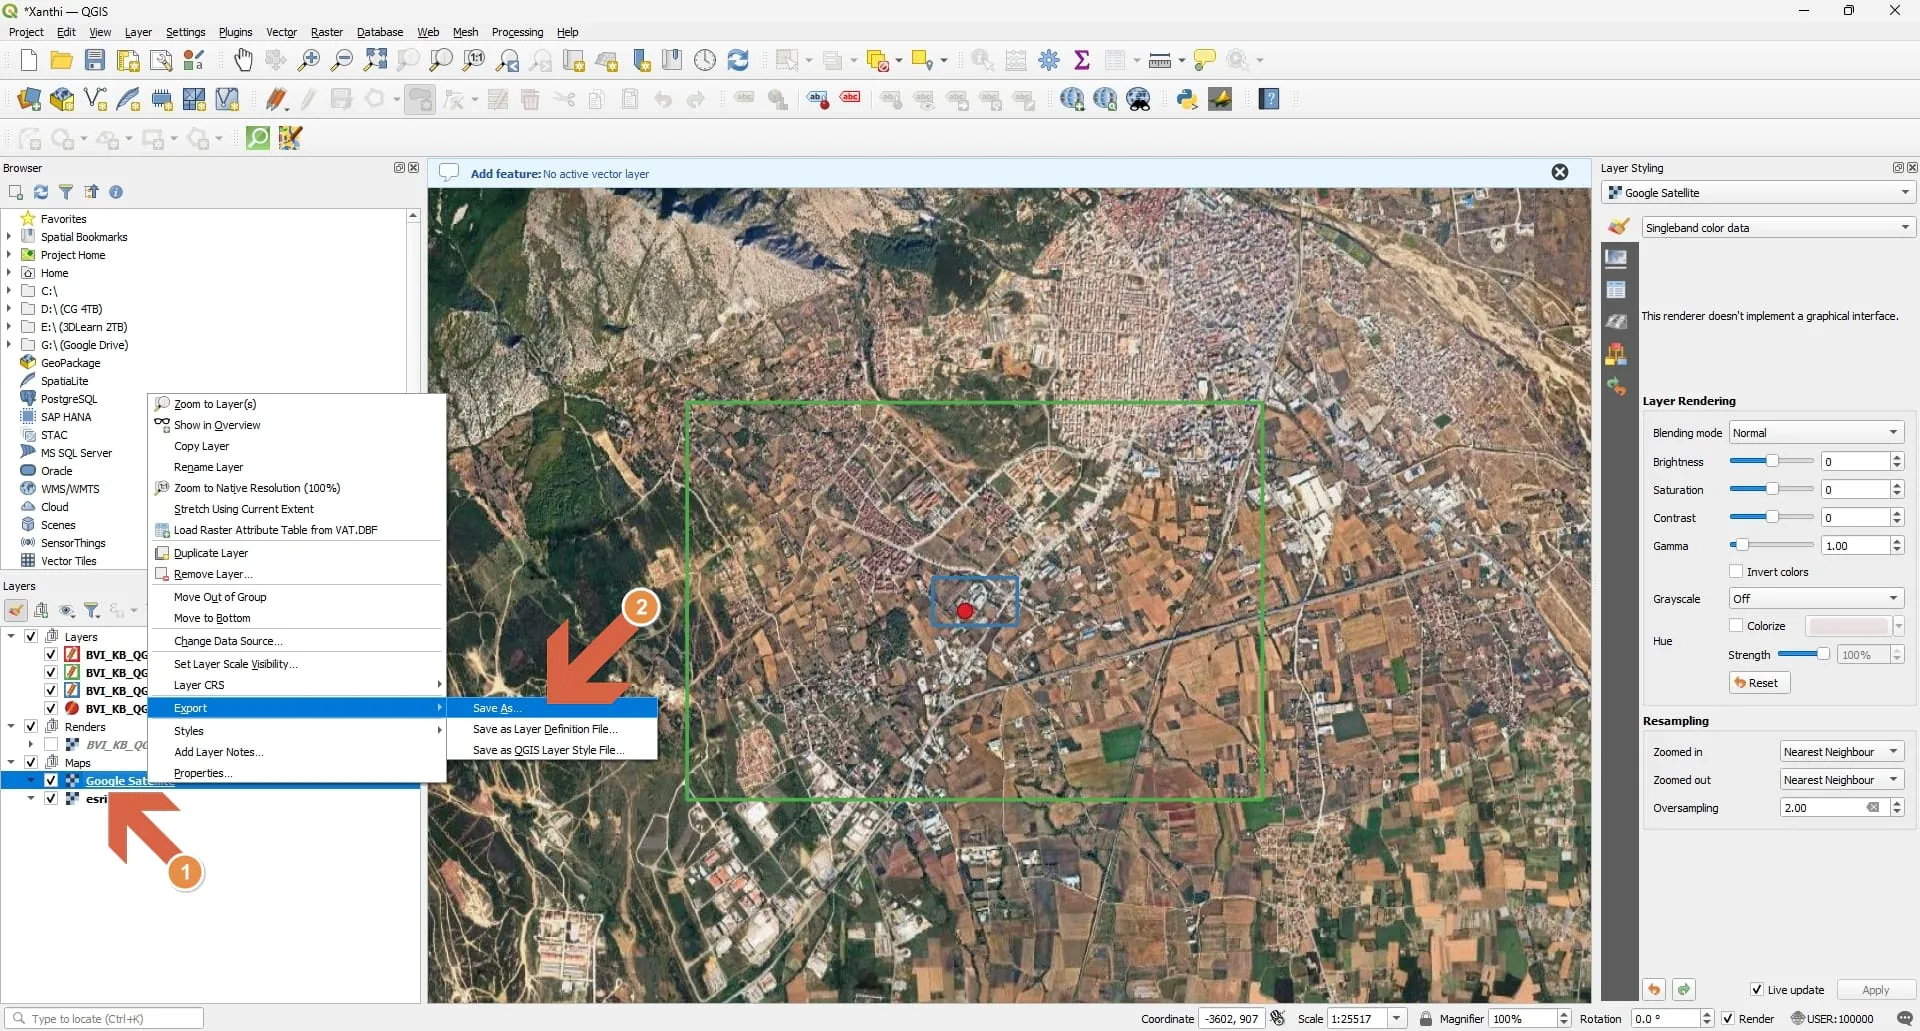 Export step 1Right click on the layer you want to export (1), choose Export → Save As... (2)
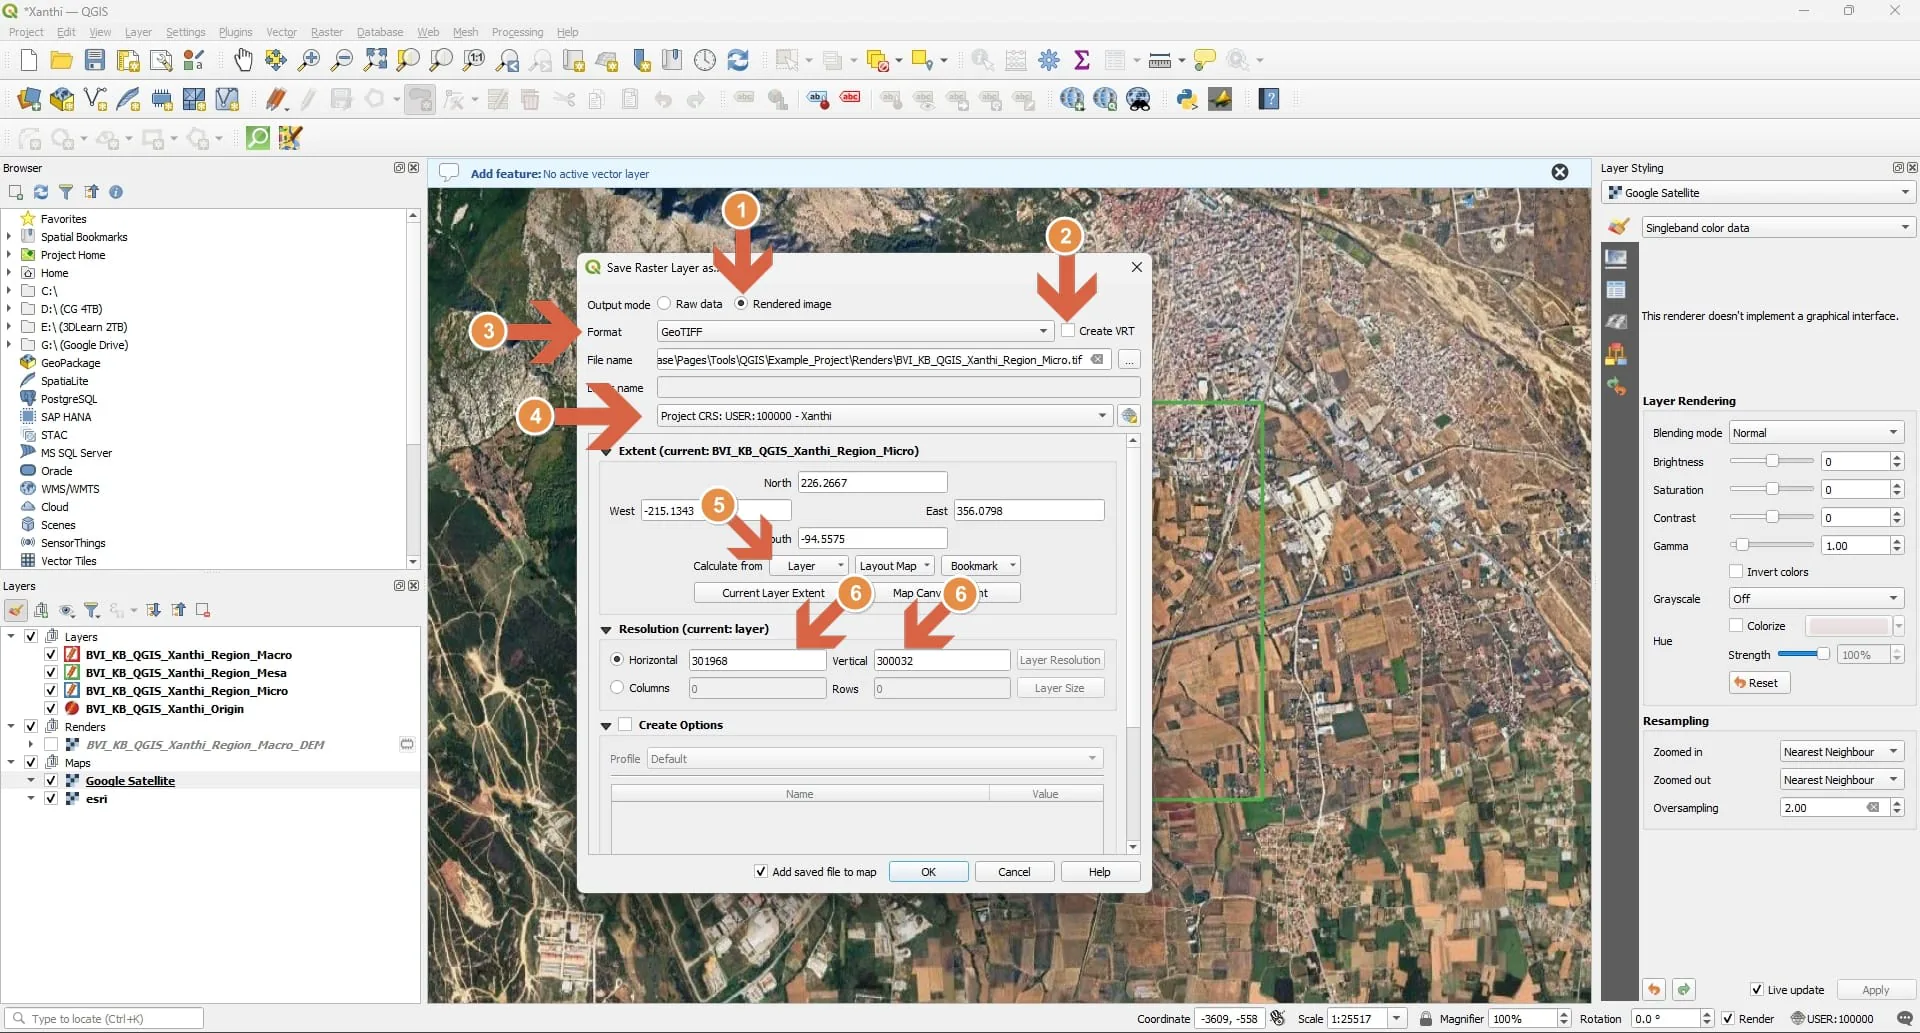 Export step 2Depending on the type of data we are saving, select either Rendered Image (for raster data) or Raw Data (for DEMs). Toggle off Create VRT (2), and select GeoTiff as file format (3). Now select a save location and filename and set the correct CRS (4). Under extent we can select layer, and set the render region to be one of the areas we have specified before (5). We can adjust the numbers under Horizontal and Vertical: if the area is large we can select a value like 15, if it is small, a value of 0.1 can do. By changing these numbers we see a new value under the column section. This is the effective resolution at which we are exporting. I try to go for around 4K per area, but beware that the higher the resolution, the higher the output file size.Export step 3In this case, a value of 0.1 gives me a resolution of 5712x3208, which is a good resolution that will capture the necessary detail without creating an excessively large file. Make sure to adjust the value to your project needs. Optionally we can toggle 'add saved file to map' to include the render in our layer stack. Now we can press OK and let QGIS download the necessary data.Export step 1Right click on the layer you want to export (1), choose Export → Save As... (2)
When exporting data from QGIS for use in BlenderGIS, ensure that:
- The CRS of the exported file matches your project's CRS (the custom one you set up in the baseline setup).
- DEMs are exported as RAW GeoTIFF (.tif) files.
- Shapefiles (.shp) are used for vector data like building footprints and roads.
Into Blender
This workflow exports three output formats, all imported with the BlenderGIS add-on:
- GeoTIFF raster (basemap, rendered image) becomes a georeferenced plane.
- GeoTIFF DEM becomes a displacement texture on that plane.
- Shapefile (roads, footprints, regions) becomes a vector mesh, optionally extruded from a height field.
Two caveats before you import. The scale is already real-world: the files carry the custom CRS from the baseline setup, so the imported geometry is in meters and needs no scaling. The alignment depends on that CRS being shared. A file exported under any other CRS will not sit on the same ground as the rest of the scene.
Base layer
 Now with the map selected go to Object, Set Origin and Origin to 3D cursor. The origin is now exactly where we have set it.
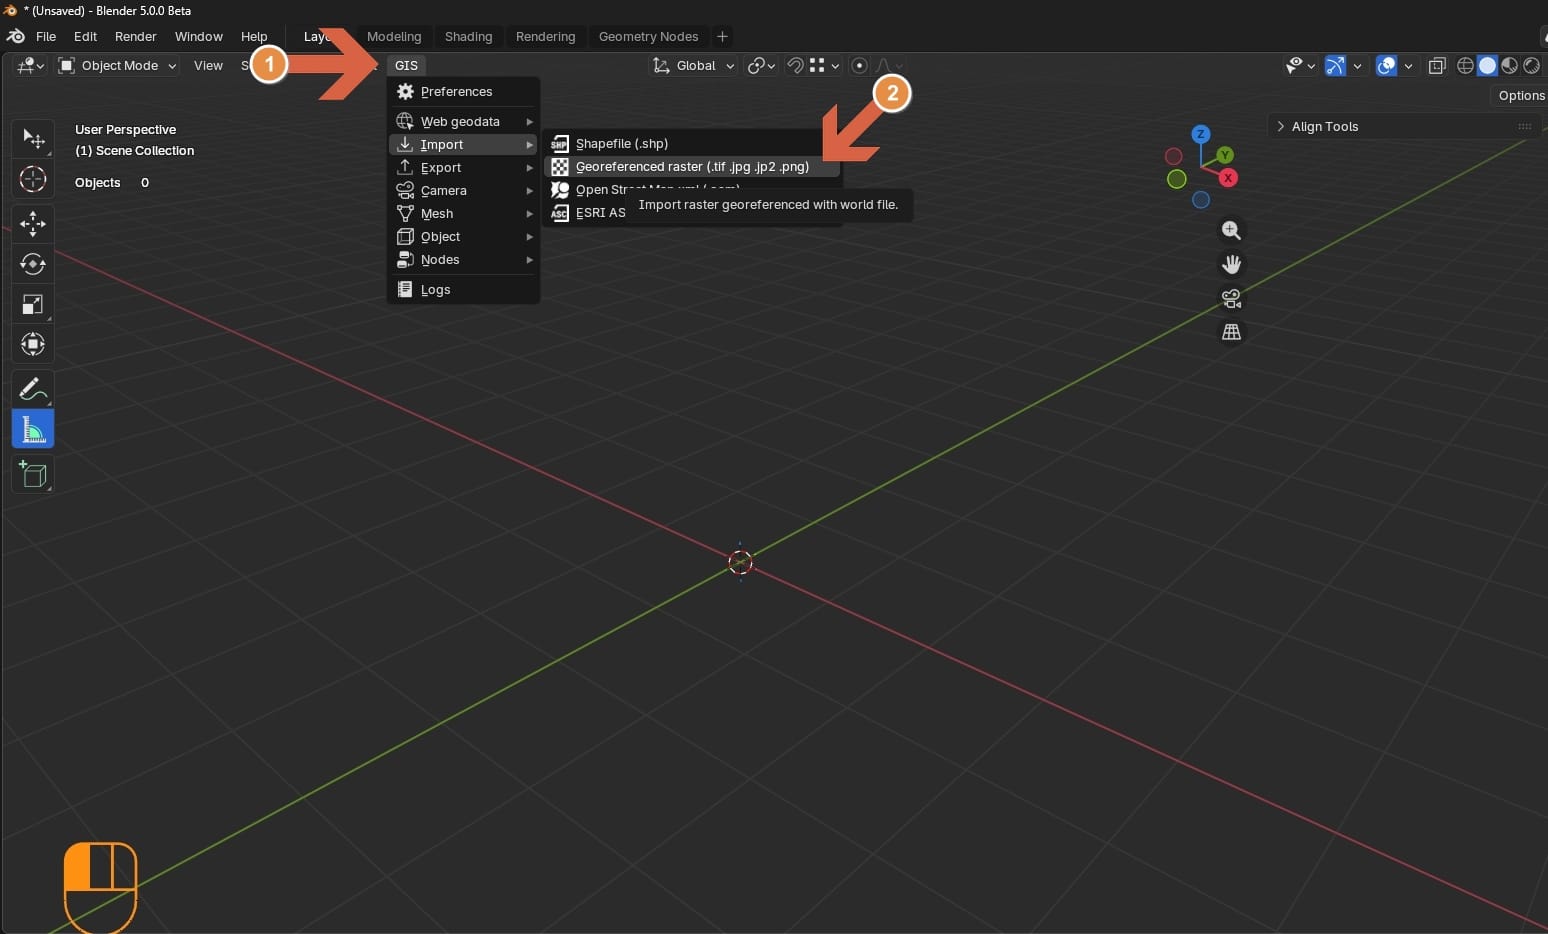 With the GIS plugin installed, click on GIS (1) and select Import - Georeferenced raster (2)
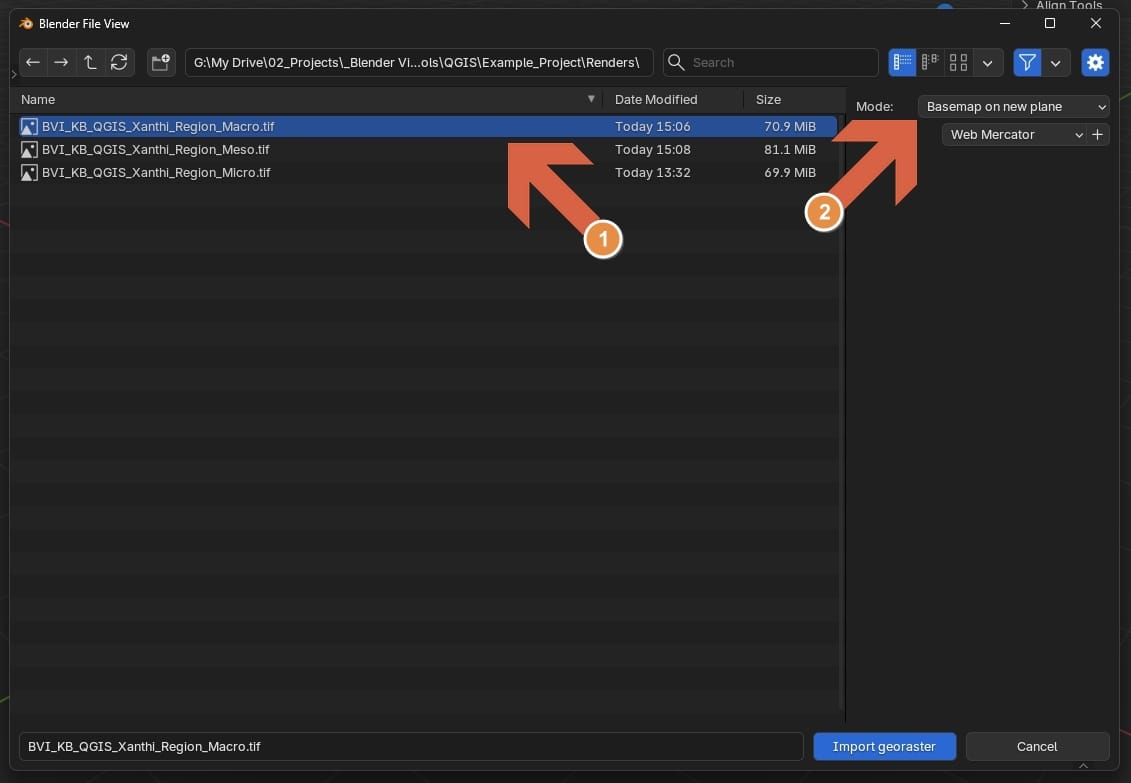 Select the file you want to import (1) and make sure to set the basemap to be a new plane (2)Now with the map selected go to Object, Set Origin and Origin to 3D cursor. The origin is now exactly where we have set it.With the GIS plugin installed, click on GIS (1) and select Import - Georeferenced raster (2)
We now have our base image imported and correctly positioned in Blender with scale matching real world scale. Next we add height to the base and then layer more detailed maps on top.
Add DEM
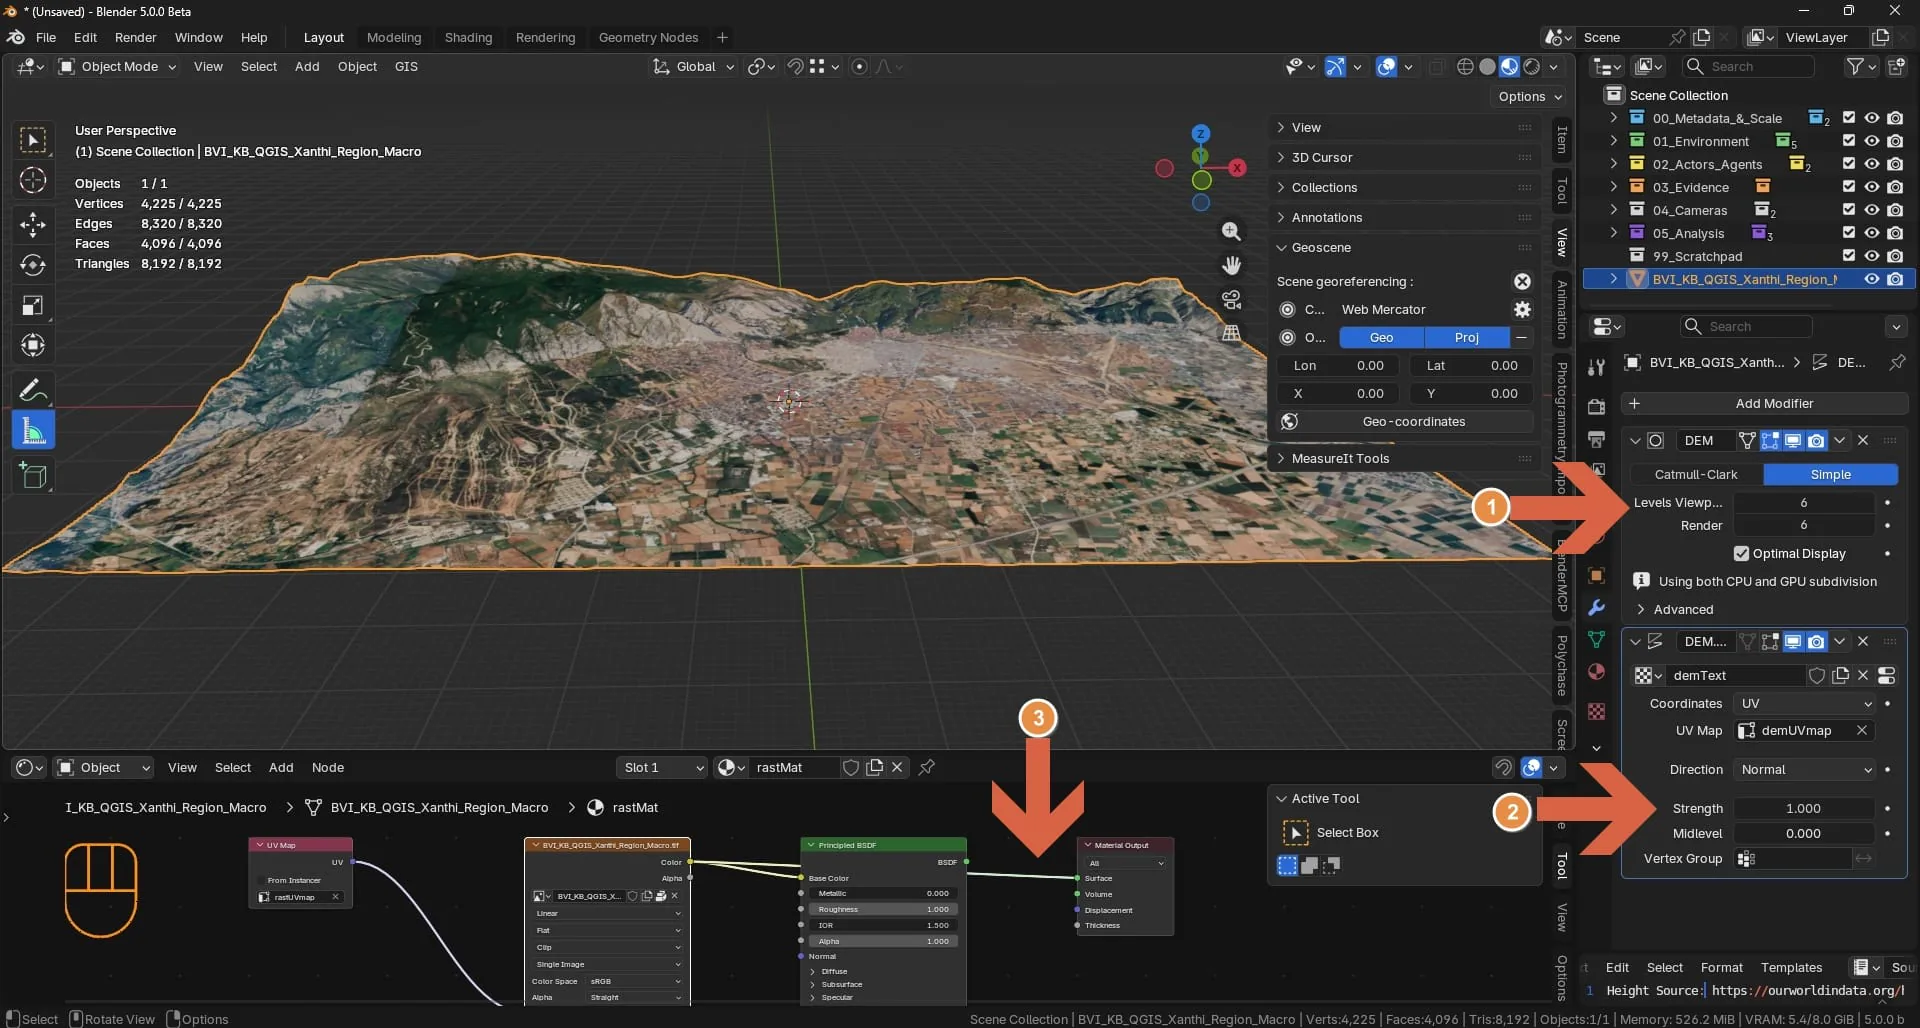 Now two modifiers have been added to our base mesh, a subdivision surface (1) and a displacement modifier (2). You can adjust the strength and subdivision levels to refine or exaggerate the terrain detail. Optionally, I also like to hook up the texture directly to the material output (3) so lighting won't affect the texture.
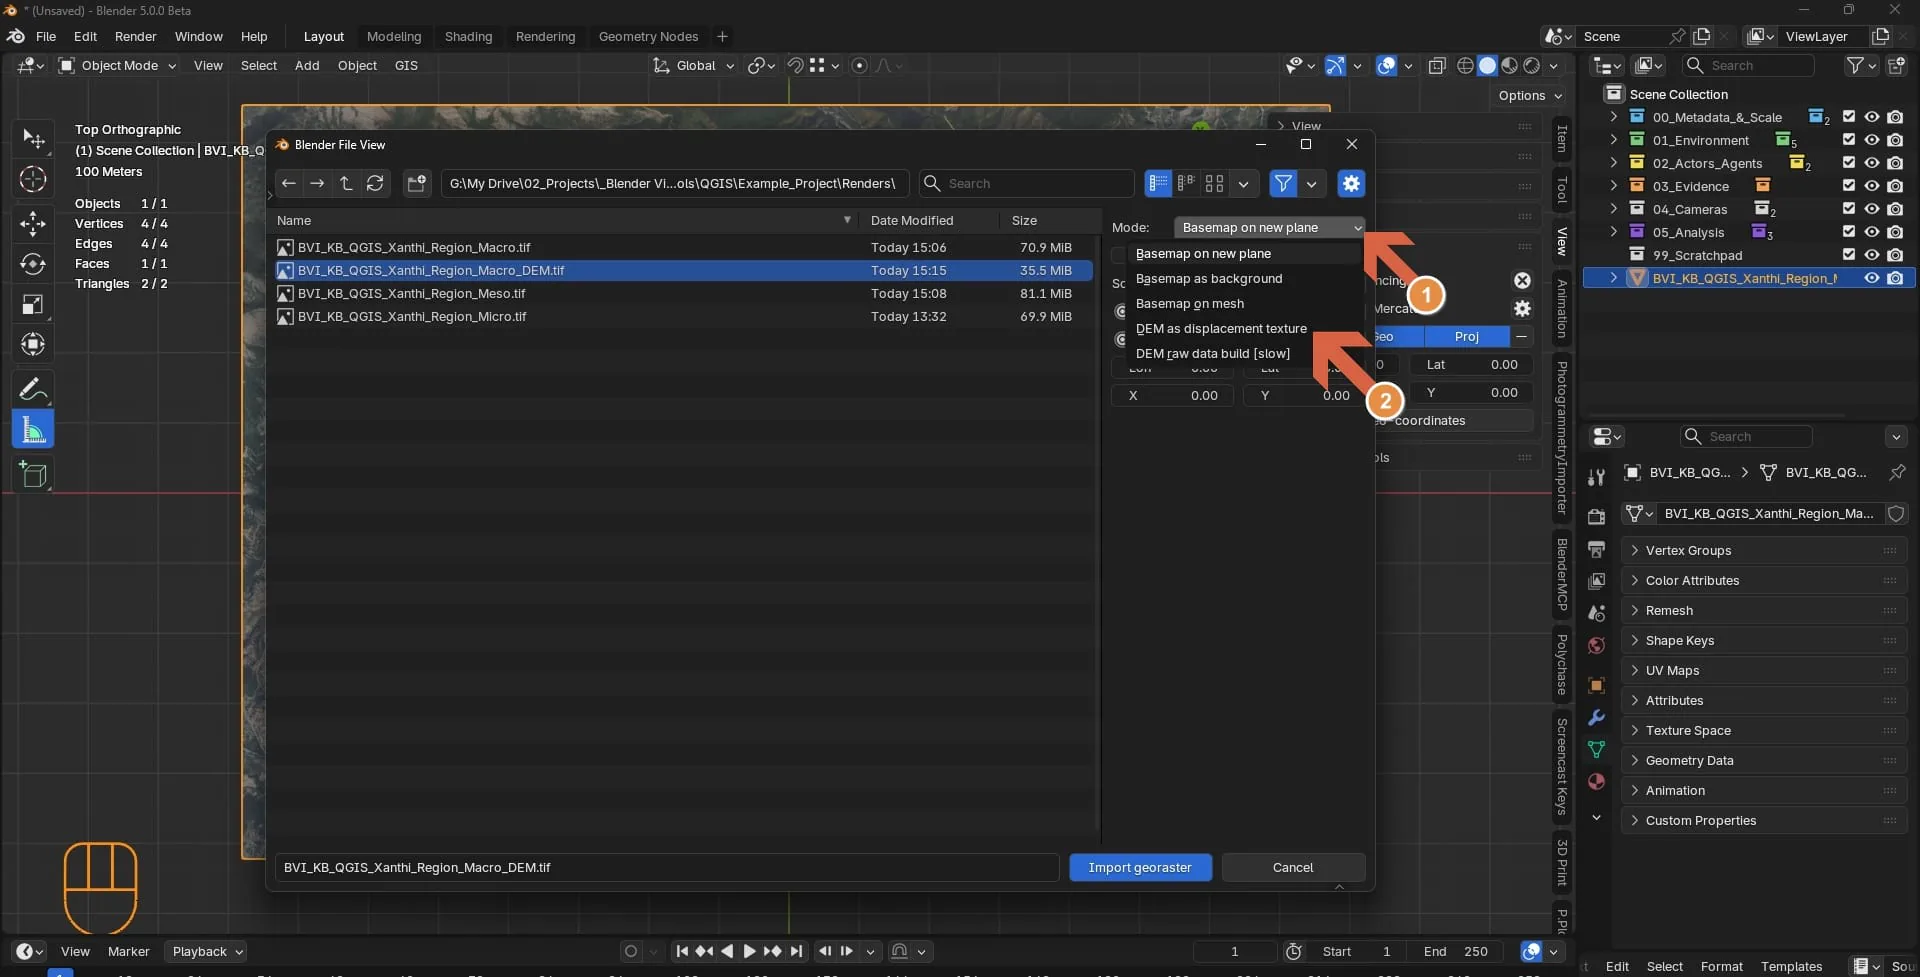 To add height to our base, import an image again, but this time make sure to set the mode (1) to 'DEM as displacement texture' (2)
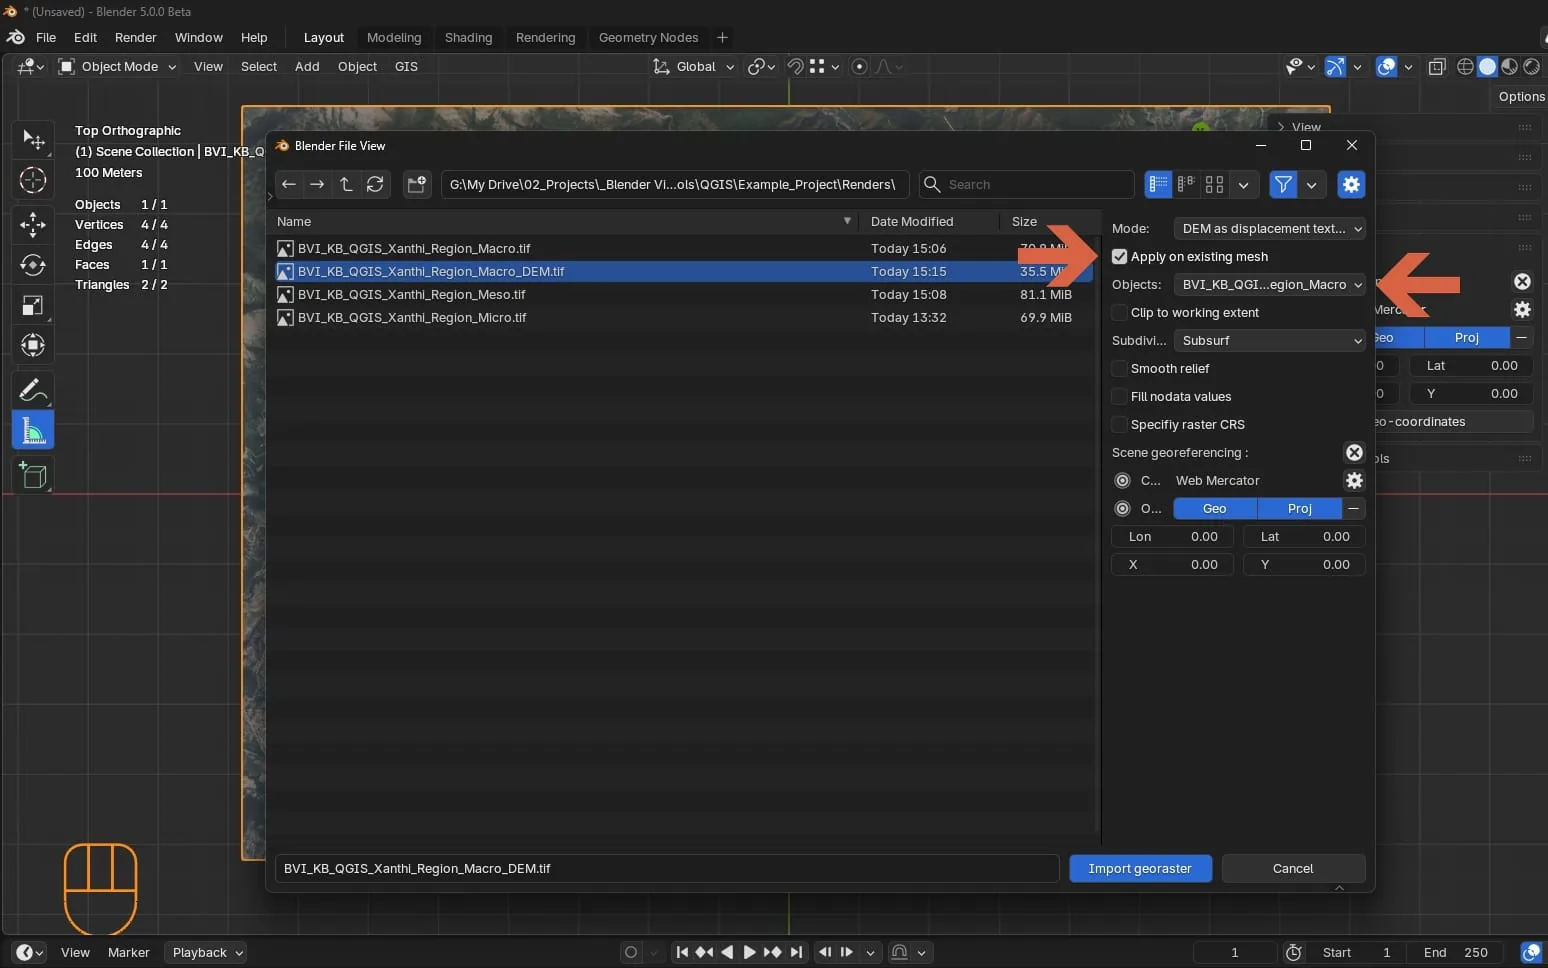 Apply the height map to an existing mesh (1) and select the object that you want to apply it to (2) (the base image we have just imported)Now two modifiers have been added to our base mesh, a subdivision surface (1) and a displacement modifier (2). You can adjust the strength and subdivision levels to refine or exaggerate the terrain detail. Optionally, I also like to hook up the texture directly to the material output (3) so lighting won't affect the texture.To add height to our base, import an image again, but this time make sure to set the mode (1) to 'DEM as displacement texture' (2)
Height is added, and our terrain now has realistic elevation based on the DEM data we exported from QGIS.
Stack layers
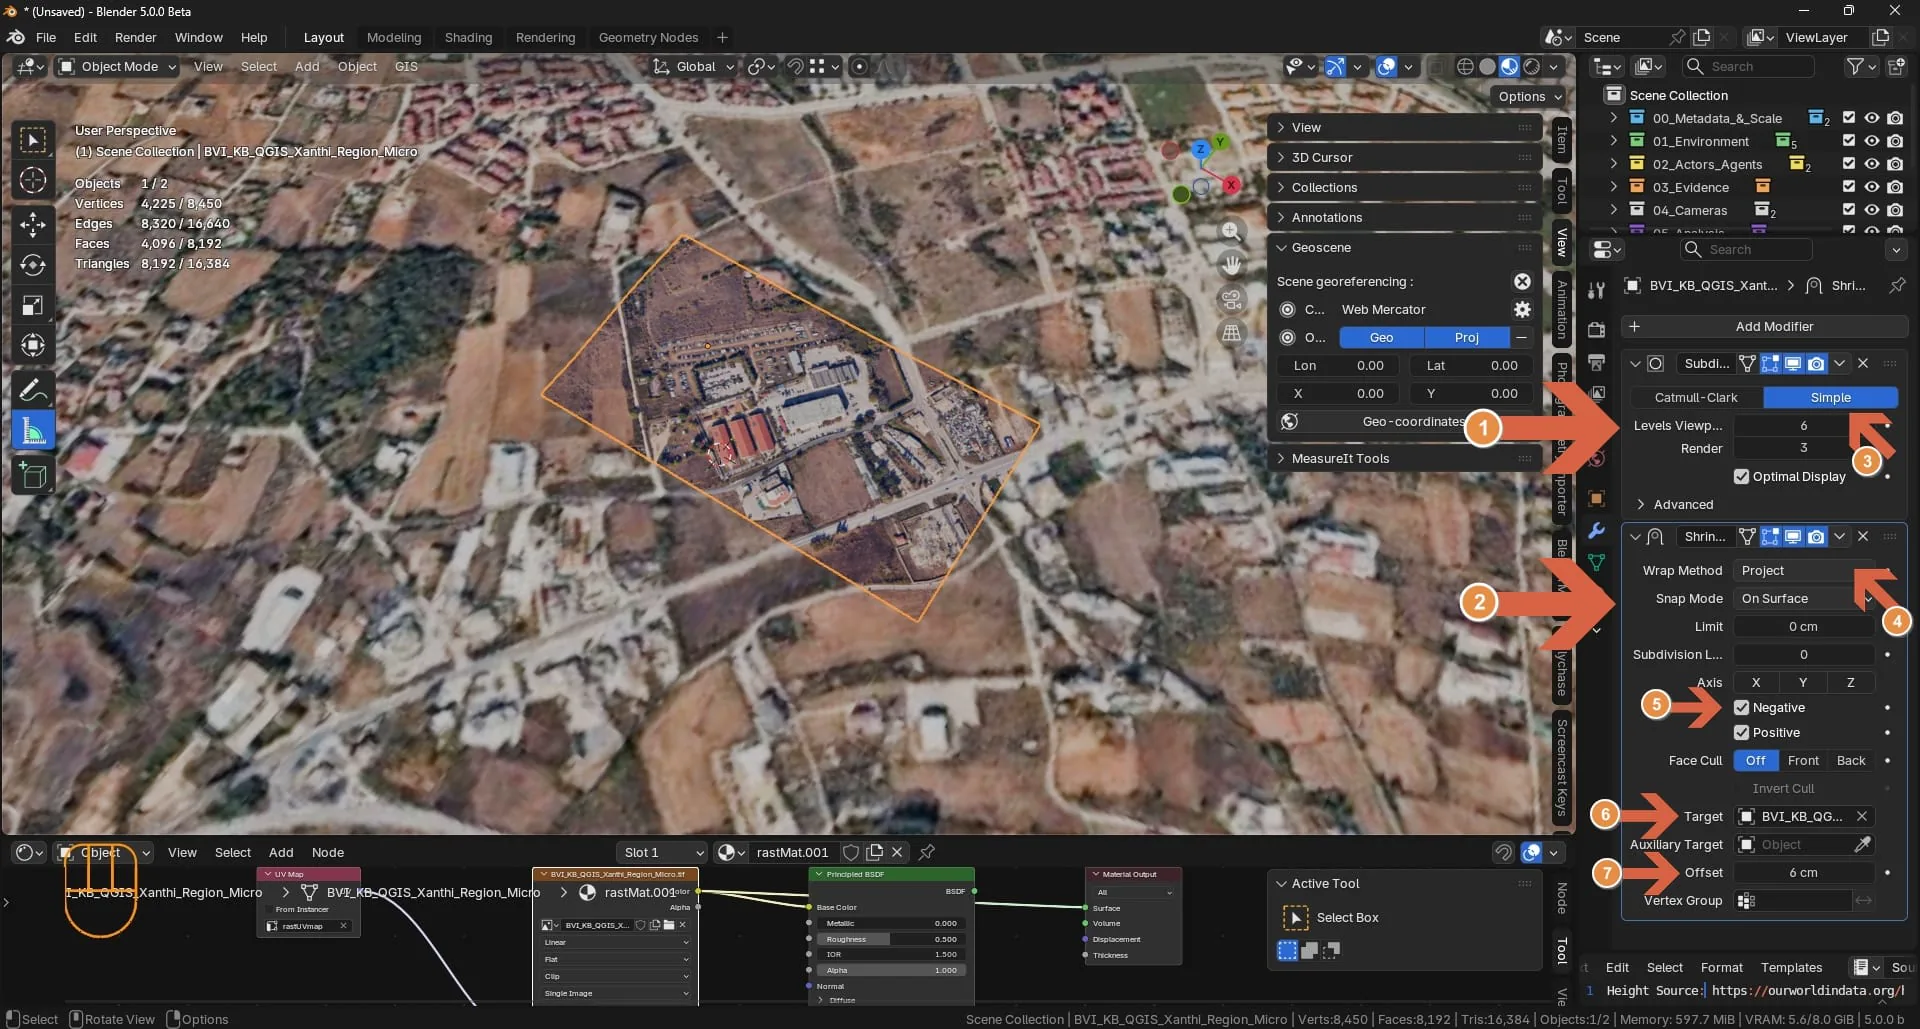 Move the mesh up so it sits on top of the base mesh. Then we can add a subdivision surface modifier (1) with a decent level of subdivision (3) and a Shrinkwrap modifier (2), set to project (4), negative (5) (so it projects 'downwards'; if you want, switch on the Z axis too), set the target to our base mesh (6) and adjust the offset slightly (7) to counter Z fighting glitches
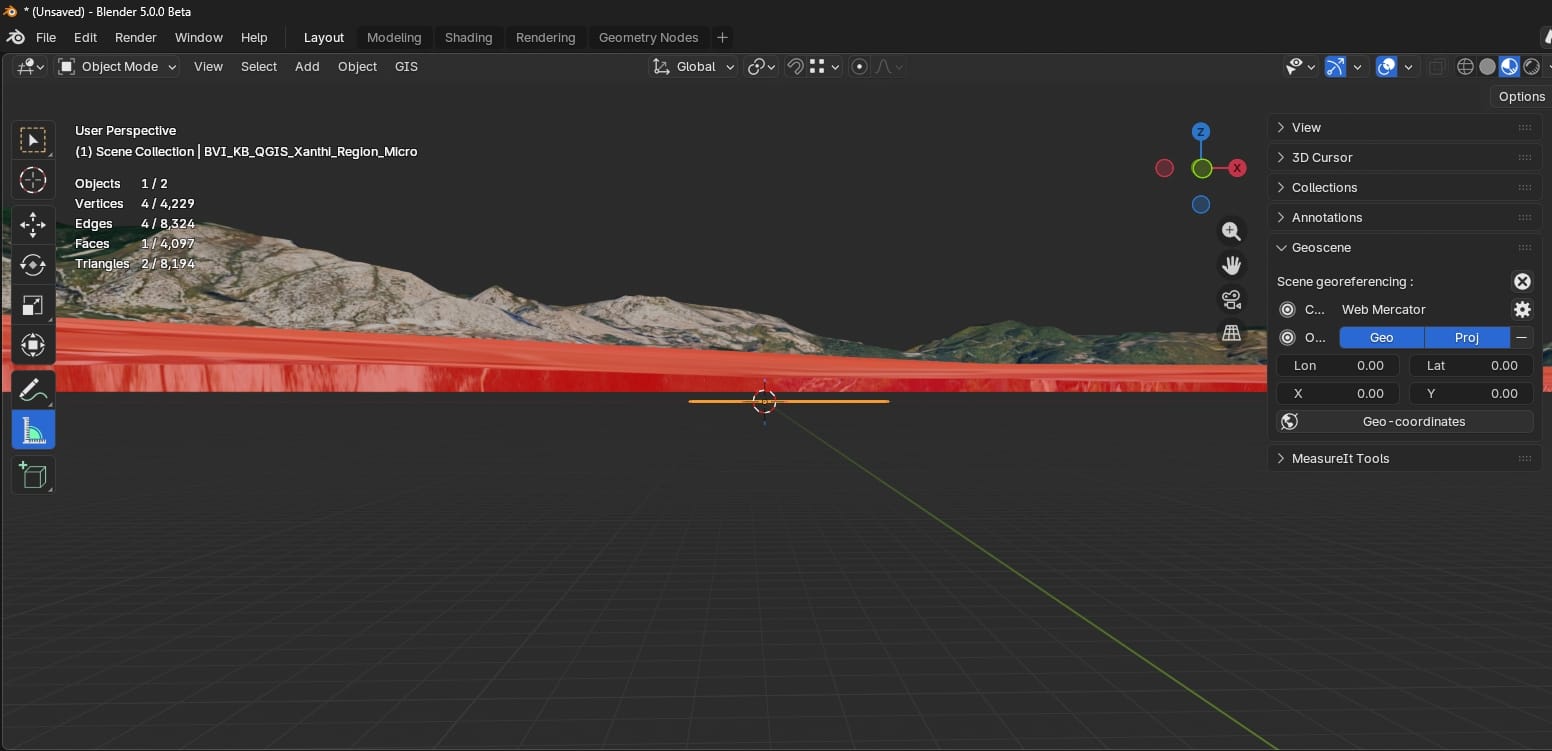 When we have exported several levels of detail (LOD) or different kinds of maps, we can layer them on top of each other so we can have more detailed and context-rich 3D models. If you follow the same import steps as before you will notice that the freshly created mesh appears below the displaced base mesh.Move the mesh up so it sits on top of the base mesh. Then we can add a subdivision surface modifier (1) with a decent level of subdivision (3) and a Shrinkwrap modifier (2), set to project (4), negative (5) (so it projects 'downwards'; if you want, switch on the Z axis too), set the target to our base mesh (6) and adjust the offset slightly (7) to counter Z fighting glitchesWhen we have exported several levels of detail (LOD) or different kinds of maps, we can layer them on top of each other so we can have more detailed and context-rich 3D models. If you follow the same import steps as before you will notice that the freshly created mesh appears below the displaced base mesh.
Stacking layers of different maps on top of each other gives us a rich and detailed 3D reconstruction of our area of interest.
In an Investigation
Record the data provenance here. The layers in your scene are claims about the site, and each one needs a source a reader can re-pull.
- Method section: for each layer, record the provider and tile source (basemap), the DEM source and resolution (for example SRTM 30m), the OSM download date and feature types, and the export extent with its effective resolution.
- Decision log: why this DEM source at this resolution, and why this basemap. Capture dates differ between providers. Note which one you compared and what you saw.
- Verification: the imported layers must stack correctly in Blender (the shrinkwrap offset holds without Z-fighting) and the ground scale must match a known distance on site.
Limitations
- Google and Bing basemaps cannot be legally exported under their terms of service. Use them as on-screen reference. Export Esri World Imagery or a licensed source for the plane that goes into the scene.
- 30 m DEM resolution means one elevation point per 900 m². The terrain it produces is context, not site topography. Do not use it to claim ground conditions at a specific position.
- OpenStreetMap quality varies by region. Check footprints and roads against current satellite imagery before treating them as accurate.
Related
Resources
- QGIS Overview, the hub for this workflow
- Baseline Setup, the previous stage
- BlenderGIS, the add-on used for the Blender import
Sources
- OpenTopography API keys, how to get the free key the DEM plugin needs
- NextGIS QuickMapServices, the basemap plugin
- QuickOSM, the OpenStreetMap downloader